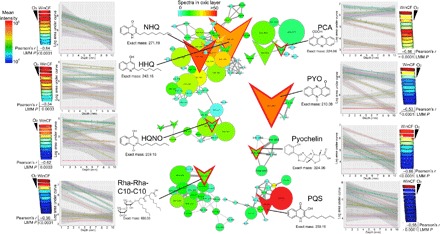
Fig. 3. Molecular networks of P. aeruginosa virulence factors and their abundance through depth in the WinCF columns.

The data are mapped onto a model of the WinCF oxygen experiment using the ‘ili software (45). The log mean intensity of each P. aeruginosa virulence metabolite through the 1- to 10-mm-depth sections of the WinCF media is shown as a heat map with the oxygen penetration shown for reference. The Pearson’s r value of the correlation with depth is shown as well as the P value from the LMM. Plots of the log area under the curve compared to depth in the WinCF media are shown colored by each patient for each metabolite of interest. The molecular networks show the metabolites of interest and their related molecules. Each node represents a unique MS/MS spectrum from the molecular networking algorithm, and edges between the nodes represent a cosine similarity between them above 0.7. Colors of the nodes are scaled to their abundance in the oxic layer of the WinCF columns (1 mm) in spectral counts, and the node size is scaled to the overall abundance of the metabolite. Structures and mass in daltons of each virulence metabolite are shown. HQNO, 2-heptyl-4-hydroxyquinolone-N-oxide.
