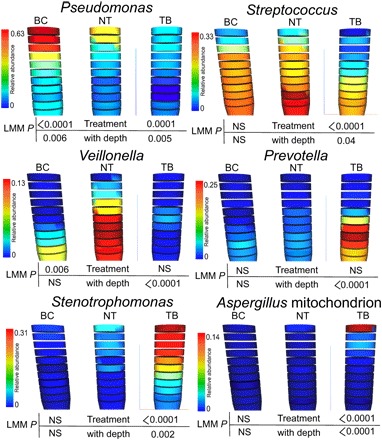
Fig. 4. The 3D models of the WinCF oxygen experiments with treatment visualized using the ‘ili software (45).

Each column represents the WinCF medium that is sectioned in 1-mm depths. The sections are colored according to the normalized abundance of bacterial genera of interest. The untreated samples (NT), bicarbonate (BC)–treated samples, and tobramycin (TB)–treated samples are shown, as well as the LMM P values with and without the depth as a mixed effect. NS, not significant.
