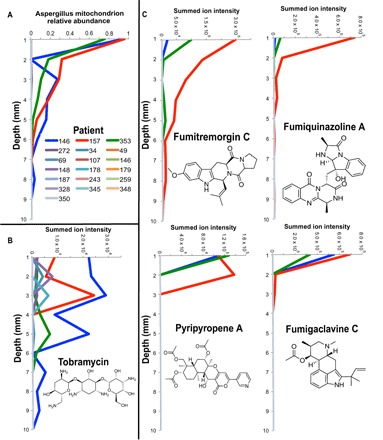
Fig. 5. Profiles of Aspergillus mitochondrion reads, tobramycin abundance, and Aspergillus specialized metabolite abundance through the WinCF oxygen gradients in the 19 patients tested in this study.

(A) Relative abundance of 16S rDNA gene reads in each patient mapping to the Aspergillus mitochondrion in tobramycin-treated WinCF tubes through the 10-mm depth. (B) Summed ion intensity of tobramycin in each patient through the WinCF 10-mm depth treated with tobramycin. (C) Spectral counts of A. fumigatus specialized metabolites in same samples.
