Figure 3.

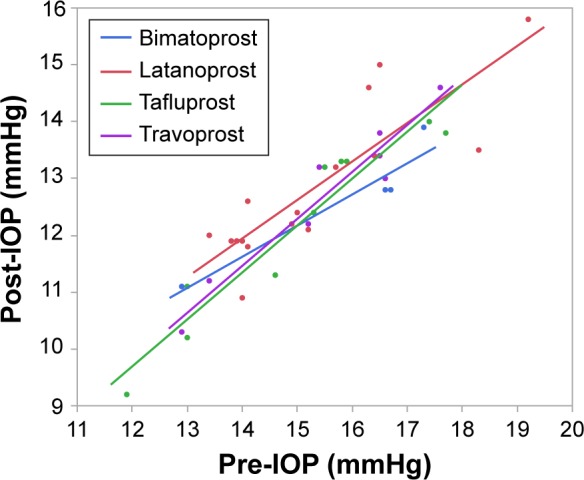
Scatter plot analysis of studies in Category 2 as a function of predosing IOP values.
Abbreviation: IOP, intraocular pressure.

Scatter plot analysis of studies in Category 2 as a function of predosing IOP values.
Abbreviation: IOP, intraocular pressure.