. 2018 Sep 17;7:e35949. doi: 10.7554/eLife.35949

Figure 1. Recording protocol, histological results and examples of HD cells.

(a) The recording environment was an elevated square platform surrounded by four walls. Two distinct visual patterns (vp1 and vp2) made of LED strips were attached to two adjacent walls. A standard paper cue card was attached to a third wall. (b) Recording sessions comprised a sequence of forty 2-min trials that alternated between vp1 and vp2 trials. (c) Sagittal brain sections showing representative recording sites in the MEC and PaS. Red circles indicate tetrode tips. (d) Distribution of tetrode tips across brain regions and different layers. MEC: medial entorhinal cortex, PaS: parasubiculum, PrS: Presubiculum, RSA: retrosplenial agranular cortex, Ctx: cortex. (e) HD firing rate polar plots for four HD cells recorded during the two light conditions (numbers indicate HD score and peak firing rate). (f) Scatter plot showing HD scores and peak firing rates of all neurons during vp2 trials. Each dot represents one cell. Lines indicate thresholds for HD cells identification. Red dots are HD cells.

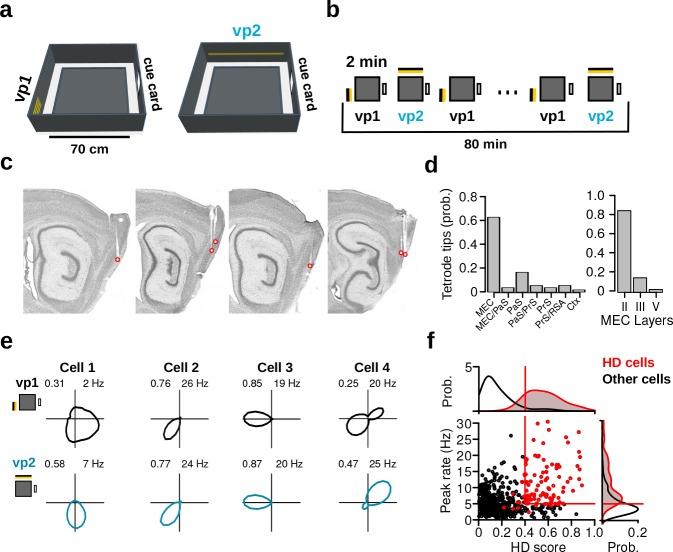
Figure 1.

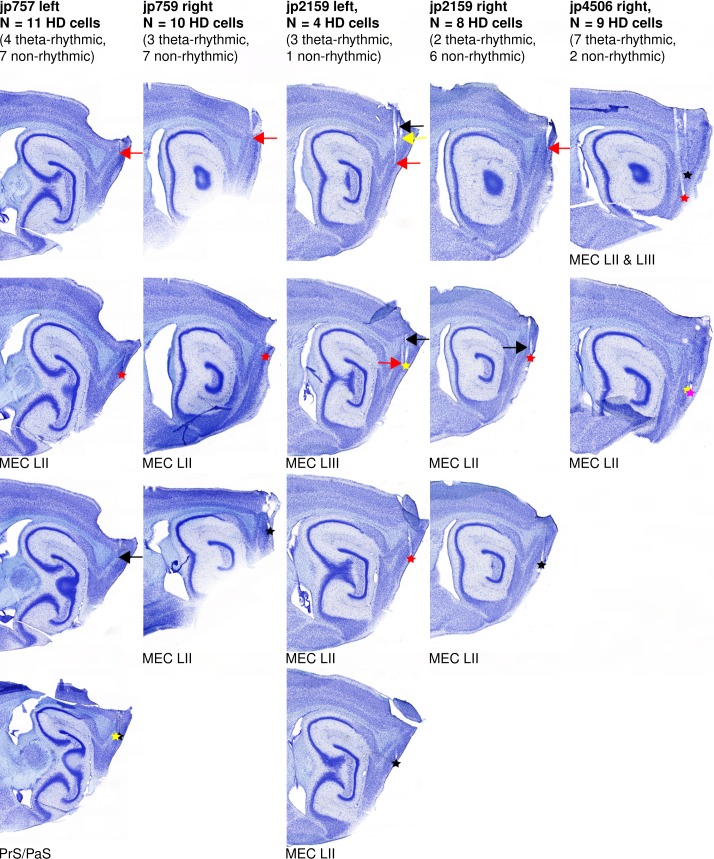
Figure 1—figure supplement 1. Examples of recording sites.

Figure 1—figure supplement 1.

Each column shows sagittal brain sections from one hemisphere. Arrows point to the tetrode tracks and asterisks show the location of the tetrode tips at the end of the experiment. For each hemisphere, a different color was assigned to each tetrode. The brain regions in which the tetrode tips were found are indicated below each section.

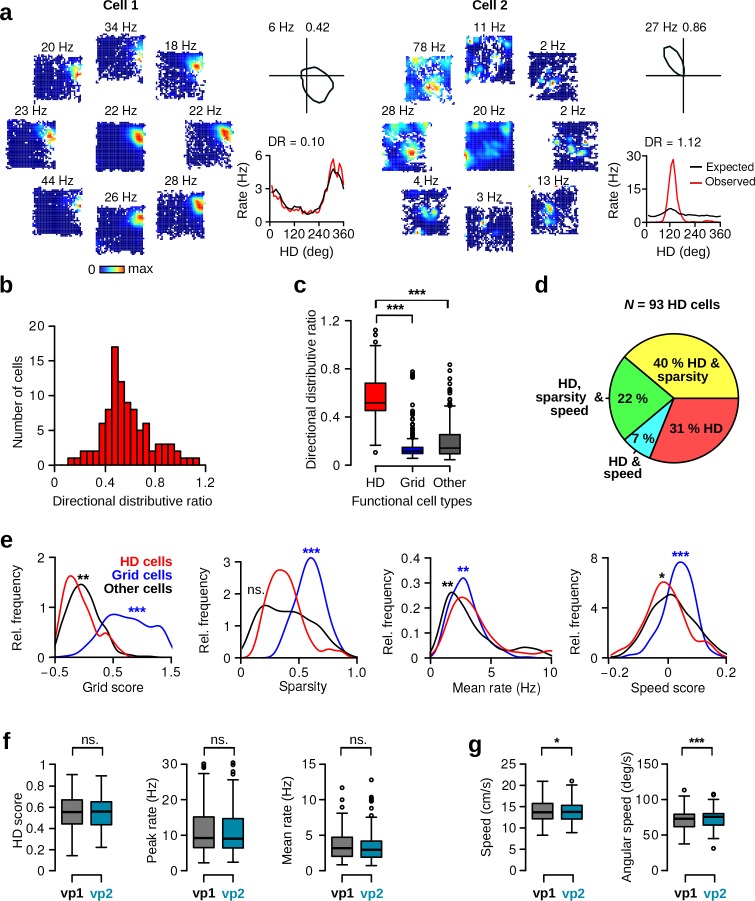
Figure 1—figure supplement 2. Directional distributive ratio, HD cell properties and behavior during vp1 and vp2 trials.

Figure 1—figure supplement 2.

(a) Directional distributive ratio (DR) for two representative HD cells with low (Cell 1) and high DR (Cell 2). Left: HD dependent spatial firing rate maps. The central rate map is direction independent. Surrounding maps show firing rate maps for specific HDs in 45 deg bins. Top right: polar plot showing the HD tuning curve of the neuron. Numbers indicate peak firing rates and HD scores. Bottom right: Observed (red lines). Expected firing rate (black lines) as a function of HD, together with corresponding DR scores. A DR near 0 indicates that the observed tuning curve of a neuron can be explained by its spatial selectivity and biased HD sampling. (b) Distribution of DR for all putative HD cells. (c) Box-and-whisker plots showing DR across different functional cell types: HD cells (HD), grid cells (Grid, N = 219), and other low firing rate cells (other, firing rate <10 Hz, N = 335). DR was computed during vp1 trials. HD cells had significantly higher DR compared to other functional cell types (Wilcoxon rank-sum test, HD vs. grid cells, w = 20085, p <1016, HD vs. other cells w = 29717, p <1016). (d) Pie chart illustrates the fractions of HD cells with significant spatial sparsity or speed scores. (e) Distributions of grid scores, sparsity scores, mean firing rates and speed scores for HD cells (red lines), grid cells (blue lines), and other cells (black lines). Asterisks indicate significant difference in scores between HD and grid cells (blue), and HD and other cells (black). (f) HD scores, peak rates and mean firing rates of HD cells during vp1 and vp2 trials (paired Wilcoxon signed-rank test, N = 93, HD score: v = 2015, p=0.52; peak firing rate: v = 2267, p=0.76; mean firing rate: it v = 2234, p=0.85). (g) Average running speed (left) and average head angular velocity (right). The magnitude of changes between the two trial types was small (paired Wilcoxon signed-rank test, N = 68 recording sessions containing HD cells, median running speed, vp1: 13.7 cm/s, vp2: 13.8 cm/s, v = 788, p=0.02; median head angularspeed, vp1: 73.0 deg/s, vp2: 75.7 deg/s, v = 522, p <105). ns.: not significant, *: p < 0.05, **: p < 0.01, ***: p < 0.001.