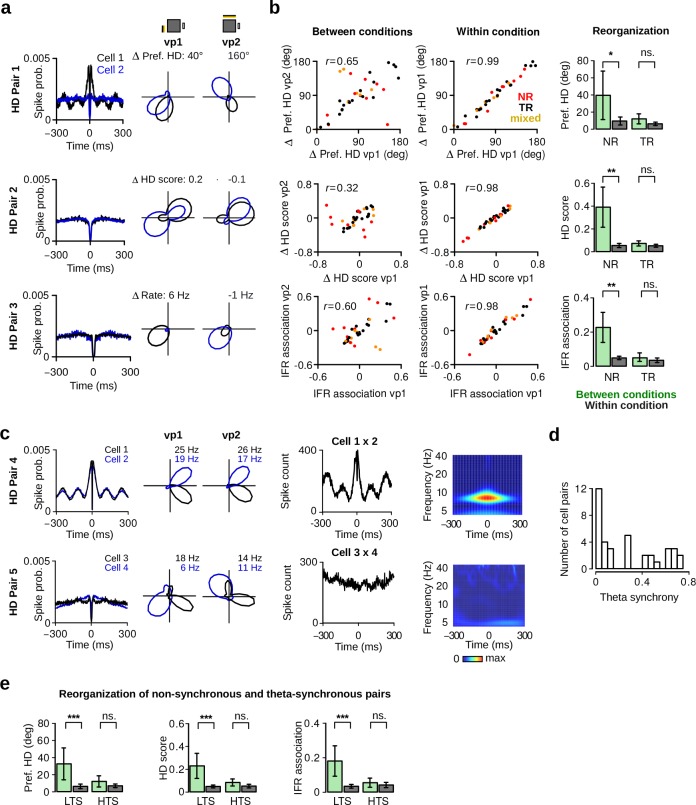
Figure 7. Reorganization of HD cells caused by changes in visual landmarks.
(a) Three pairs of HD cells recorded simultaneously showing non-coherent changes. From left to right: Spike-time autocorrelations, HD polar plots of HD cell pairs during vp1 and vp2 trials. Numbers above the polar plots indicate the difference in preferred HD (HD Pair 1), in HD score (HD Pair 2) or in mean firing rate (HD Pair 3). (b) Left: correlation between the differences in preferred HD, in HD score and in instantaneous firing rate (IFR) association of HD cell pairs for trials with the same or different visual patterns. Data are shown for vp1 and vp2 trials (left, between conditions) or for two mutually exclusive subsets of vp1 trials (right, within condition). r values are correlation coefficients. Red, black and yellow data points represent non-rhythmic, theta-rhythmic and mixed cell pairs, respectively. Right: reorganization of preferred HD, HD score and IFR association of non-rhythmic (NR) and theta-rhythmic (TR) HD cell pairs between conditions or within condition. Plots show mean 95% confidence intervals. (c) From left to right: spike-time autocorrelations, polar plots, spike-time crosscorrelations and wavelet transforms of the z-score-based spike-time crosscorrelations. Both wavelet transforms were normalized to the same scale from minimal power (dark blue) to maximal power (dark red). Wavelet transforms reveal high theta frequency synchronization for one of the HD cell pairs (HD Pair 4). (d) Distribution of theta synchrony scores for all HD cell pairs. (e) Reorganization for HD cell pairs with low (LTS) or high (HTS) theta synchrony. ns.: not significant, *: p 0.05, **: p 0.01, ***: p 0.001.

