
Figure 1. FluoEM applications and concept.
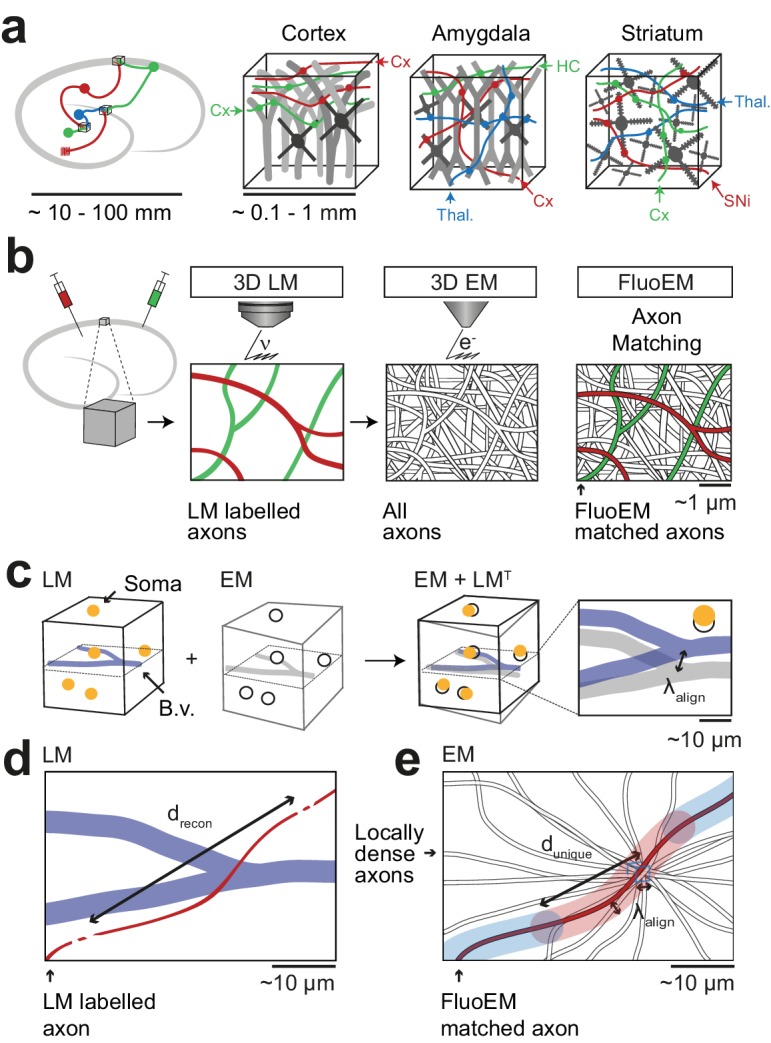
(a) Most local circuits in mammalian brains can be mapped densely by modern 3D EM (gray neurons), but the source of a majority of the relevant input axons remain unidentified (colored), because the projections arise from distal brain regions (see sketch on the left). Examples show upper layers of cortex, Amygdala and Striatum with dominant input from other cortices (Cx), Thalamus (Thal.), Hippocampus (HC), Substantia Nigra (SNi). Deciphering the connectomic logic of these inputs within a densely imaged neuronal circuit requires parallel axonal labels in a single EM experiment. Mapping color-encoded information on multiple axonal origins from LM data into 3D EM data useable for connectomic reconstruction in mammalian nervous tissue is the goal of the presented method. (b) A brain tissue sample containing fluorescently labeled axons is volume imaged first using confocal laser scanning microscopy (LM) and then using 3D electron microscopy (EM). The fluorescently labeled axons (red and green) contained in the LM dataset are then matched to the corresponding axons in the EM dataset (black and white) solely based on structural constraints (see b-d), without chemical label conversion or artificial fiducial marks. (c) Coarse LM-EM volume registration based on intrinsic fiducials such as blood vessels (blue) and somata (yellow) can be routinely achieved at a registration precision of about 5 –10 µm (Bock et al., 2011; Briggman et al., 2011). (d) The path length over which fluorescently labeled axons (green and red) in a volume LM dataset are clearly reconstructable depends mostly on the labeling density in the respective fluorescence channel. Blue, blood vessels (B.v.). (e) Axons (grey) traversing a common bounding box (blue) of extent become increasingly distinguishable with increasing distance from the common origin. After a distance , a given axonal trajectory is unique, that is no other axon from the center bounding box is still closer than . Since 3D EM allows the reconstruction of all axons traversing a given bounding box, can be determined (see Figure 2). If axons can be reconstructed at the LM level for a path length (c) that is similar to or larger than the typical axonal uniqueness length (d), the FluoEM approach can in principle be successful.