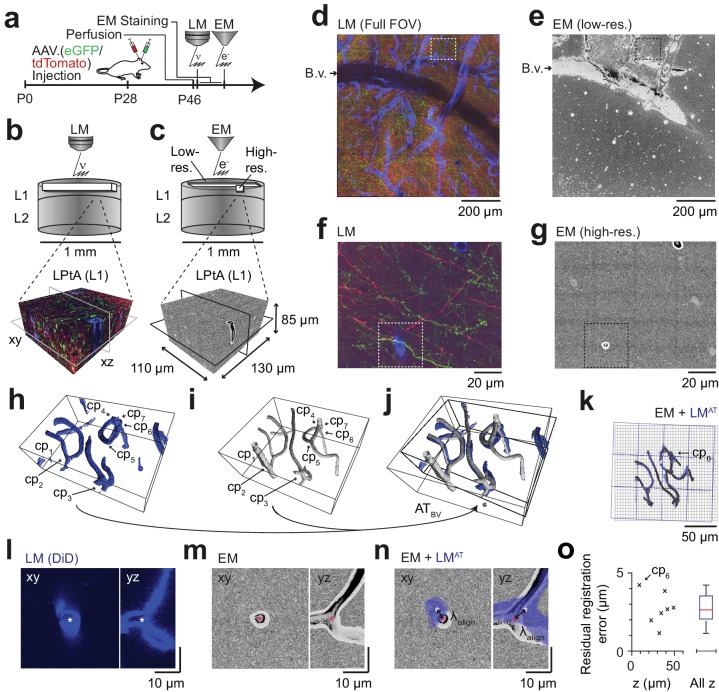
Figure 3. Coarse LM-EM registration.
(a) Experimental timeline for FluoEM experiment (continued from Fig. 2a). After LM imaging was concluded the sample was immediately stained for EM and embedded, followed by 3D EM imaging. (b,c) Sketch of sequentially acquired 3D LM and EM datasets from cortical layer 1 (L1). Fluorescence channels: green (axonal projections from M1 cortex, eGFP); red (axonal projections from S2 cortex, tdTomato); blue (blood vessels, DiD). Volume and voxel size of EM datasets: (1500 x 1000 x 10) µm3 and (700 x 700 x 200) nm3 (low-resolution EM dataset), (130 x 110 x 85) µm3 and (11.24 x 11.24 x 30) nm3 (high-resolution EM dataset). (d,e) Overview images of the LM (d, https://wklink.org/5974) and low-resolution EM (e, https://wklink.org/4610) datasets. Dashed rectangle indicates the position of the high-resolution EM dataset (g, see c for relative positions of datasets). B.v., blood vessel. Note the corresponding pattern of surface vessels in d,e. (f,g) High-resolution images at corresponding locations in LM (f, https://wklink.org/1204) and EM (g, https://wklink.org/5386). Dashed rectangles indicate regions shown in l-n. (h,i), Rendering of blood vessel segmentations in LM (h) and EM (i) and their characteristic bifurcations used as control point pairs (cp1-7) to constrain a coarse affine transformation (ATBV). (j) Overlay of the EM and LMAT blood vessel segmentations registered using ATBV. (k) Registered blood vessels (lines) and control points (circles) overlaid with EM (black) and transformed LM (blue) coordinate grids. (l–n) LM (l) and EM (m) image planes (xy) and reslice (yz) showing an exemplary blood vessel bifurcation (asterisk indicates cp6, see h-k) and the overlay (n) of the affine transformed LM blood vessel segmentation with EM. Arrows indicate registration residual, a measure of the coarse alignment precision . (o) Alignment precision reported as residuals of control point alignment along dataset depth (denoted with z) (mean: 2.7 ± 1.1 µm, median: 2.7 µm) after affine transformation ATBV.

