Figure 4. Initial LM-to-EM axon matching.
(a,b) LM image plane showing an axon (green) overlaid with its LM-based skeleton reconstruction (ax1LM, black) and a nearby blood vessel (B.v., blue) bifurcation (a, https://wklink.org/1399). Dashed rectangle, region magnified in (b, https://wklink.org/5406). (c,d) EM image plane showing the blood vessel (B.v.) corresponding to the vessel shown in (a,b) overlaid with the coarse affine transformation (see Figure 3) of the LM-based axon reconstruction ax1LMAT; magnified in d. Note that ax1LMAT does not match the ultrastructural features at high-resolution EM (d) due to the limited precision of ATBV. (e,f), EM plane overlaid with ax1LMAT (as shown in c) with bounding box for dense axon reconstruction (light blue) of edge length = 5 µm; demagnified in f, dashed rectangle denotes region shown in e. (g) Skeleton reconstructions of all n = 193 ax1EM candidates (light grey) traversing the search bounding box (as in e-f), https://wklink.org/5897 (h) Reconstructed ax1EM candidates (light grey) and the transformed fluorescent axon skeleton ax1LMAT (black). Five candidate EM reconstructed axons with the most similar trajectories as ax1LMAT highlighted in different colors. (i) Number of EM-reconstructed axons persistently within the neighborhood of the LM-based template axon ax1LMAT. Note that at a distance of 43 µm from the seed center (e-h), only one possible ax1EM candidate (green) remains. (j) Overlay of ax1LMAT and the most likely ax1EM candidate reconstruction. Axonal varicosities (filled circles) were independently annotated in LM and EM. Note the strong resemblance of the varicosity arrangements indicating that ax1EM is the correctly matched EM equivalent of the LM signal (see Figure 4—figure supplement 1) for statistical analysis). (k) EM plane with overlaid ax1EM skeleton (dark green) and volume annotation of the corresponding EM axon ultrastructure (transparent green), https://wklink.org/3268.

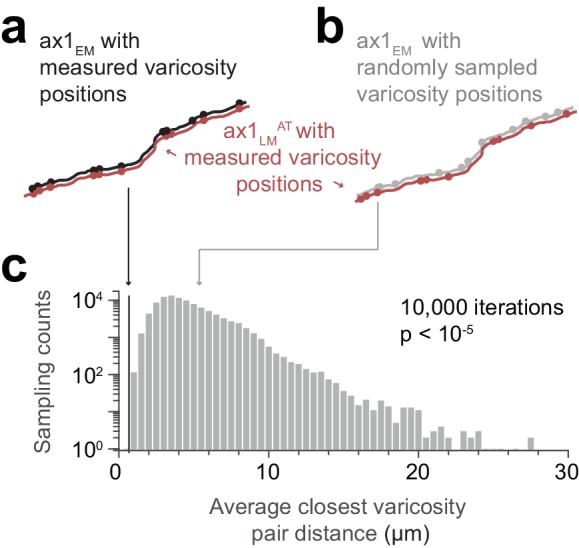
Figure 4—figure supplement 1. Similarity of matched varicosity patterns between LM and EM.