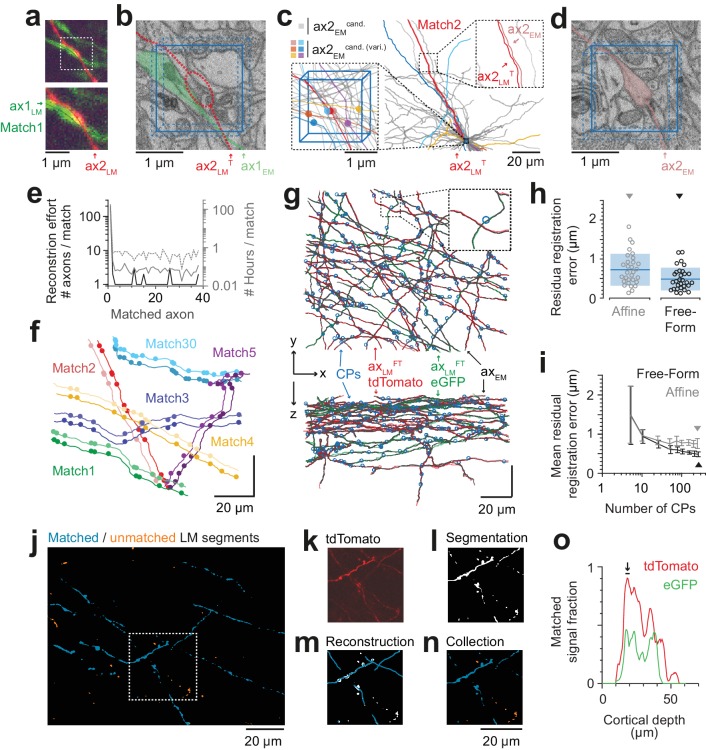
Figure 5. Iterative LM-to-EM axon matching.
(a) Initial axon match ax1LM and nearby axon ax2LM with a varicosity in the proximity, both reconstructed in LM, https://wklink.org/4334. (b) Matched axon ax1EM (light green) and trajectory of axon 2 (ax2LMT) reconstructed at LM and transformed to EM (dashed red line) using a transformation T that was constrained using structural features of the initially matched ax1 (eight control points), https://wklink.org/3305. (c) Search volume sized (2 × 2× 3 ) µm3 (blue box) around the varicosity of ax2LMT (see a-b) containing 34 candidate axons (gray) but only six with candidate varicosities (colored circles). One candidate axon had a similar trajectory as ax2LMT (right inset), identifying it as the correct match (see also varicosity pattern in f). (d) Varicosity in EM of axon ax2EM (red shading, see search template in b), https://wklink.org/3820. (e) Reconstruction effort in terms of number of reconstructed axons (black) and time (grey) required to perform 38 iterative LM-to-EM axon matches. Total effort including full EM-based axon reconstruction and control point placement in LM and EM (dashed grey). (f) Overlay of EM (light colors) and affine transformed LM (dark colors) axon reconstructions of six exemplary matched axon pairs with locations of axonal varicosities (independently reconstructed at LM and EM level, respectively). Note the similarity of axon trajectory and varicosity positions, also for the 30th matched axon. EM axons were offset by 6 µm for visibility, see g for actual overlap quality. (g) Overlay of EM-reconstructed axon skeletons (black) with the matched LM-reconstructed skeletons transformed using a free-form transformation iteratively constrained by control points (CPs, blue circles) obtained from each consecutive axon match (shown transformation used a random subset of 250 (of 284) CPs). (h) Residual registration error of the match shown in g computed as the Euclidean distances || cpEM – cpLMFT || between n = 30 randomly picked CP pairs that had not been previously used to constrain the registration. Sample mean (blue line) and standard deviation (blue shading). (i) Average residual registration error (mean ± s.d., computed as in h) in dependence of the number of randomly chosen control points (CPs) used to constrain the transformation (n = 10 bootstrapped CP sets, each). (j–n) Locally complete LM-to-EM matching of fluorescently labeled axons. One example image plane of LM dataset (at 18 µm depth) shown with EM-matched fluorescence signal fraction (blue) and yet unmatched segments (orange). To compute the matched fluorescence signal fraction, the raw LM data (k) was binarized and segmented (l, see Materials and methods), overlaid with the EM-matched LM axon skeleton reconstructions (m) and only those segments overlapping with skeletons were counted as matched (n). (o) Matched signal fraction (in fraction of matched voxels) over dataset depth. For a range of 17–20 µm depth (black line, arrow), about 90% of the fluorescent voxels were explained by matched EM axons.
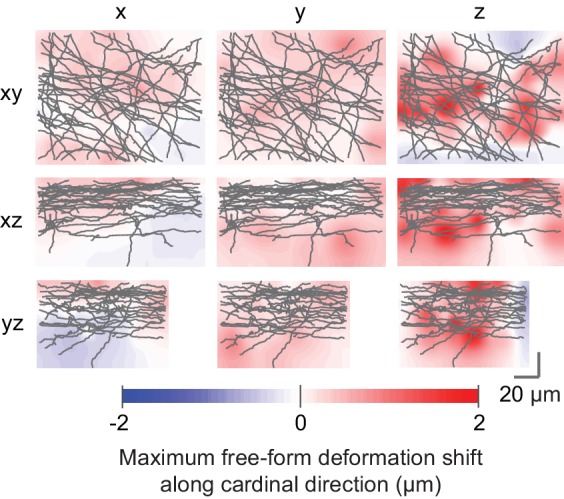
Figure 5—figure supplement 1. Deformations of axons in LM vs EM data.


