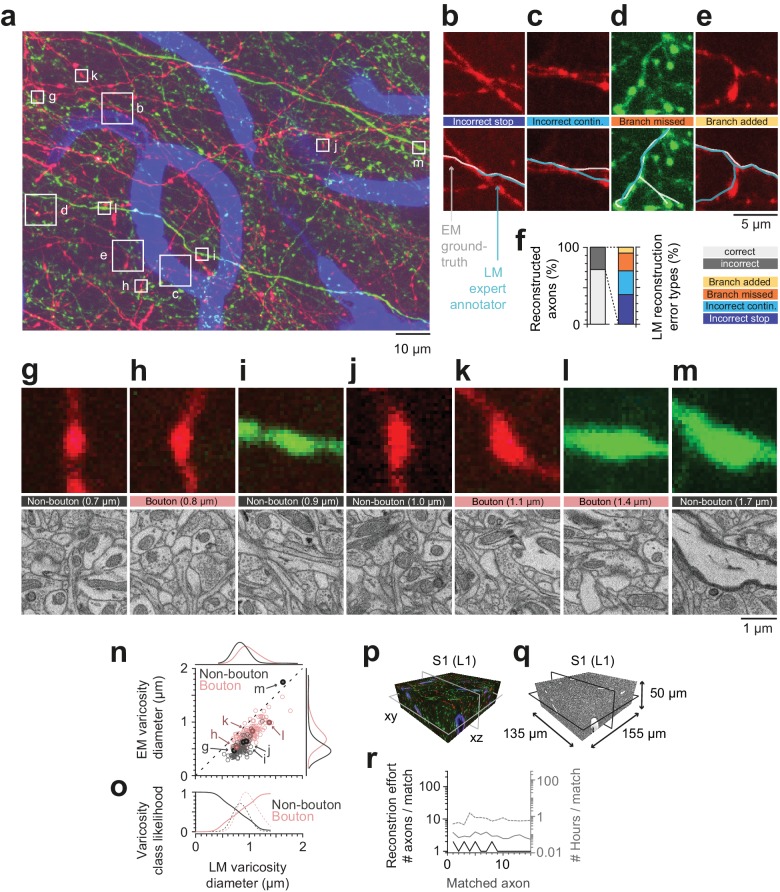
Figure 6. Calibration of axons and synapses in 3D fluorescent data using FluoEM, and reproduction experiment.
(a) Examples of axonal trajectories and axonal varicosities in 3D LM data (Maximum-intensity projection from 42 image planes at 17–35 µm depth; dataset and color code as in Figure 3). (b–f) Post-hoc comparison of axonal reconstructions in LM data and their EM counterparts as identified by FluoEM, which were considered ground truth. Examples of LM reconstruction errors (b–e) and their prevalence (f). Note that while about 70% of axons were correctly reconstructed at the LM level, for about 30%, reconstruction errors such as missed branches or incorrect continuations occurred. Direct links to example locations in the dataset for viewing in webKnossos: b, https://wklink.org/1500 and https://wklink.org/8693; c, https://wklink.org/2441 and https://wklink.org/8447; d, https://wklink.org/5600 and https://wklink.org/4519; e, https://wklink.org/1977 and https://wklink.org/6578. (g–m) Validation of presynaptic bouton detection in fluorescence data: Examples of axonal varicosities imaged using LM (top row) and EM (bottom row). EM was used to determine synaptic (bouton) vs. non-synaptic varicosities. Size of varicosity reported as sphere-equivalent diameter (see Materials and methods). Direct links to example locations in the dataset for viewing in webKnossos: g, https://wklink.org/3721 and https://wklink.org/8170; h, https://wklink.org/6118 and https://wklink.org/7611; i, https://wklink.org/7447 and https://wklink.org/3702; j, https://wklink.org/9694 and https://wklink.org/6772; k, https://wklink.org/4867 and https://wklink.org/0276; l, https://wklink.org/7809 and https://wklink.org/2224; m, https://wklink.org/7269 and https://wklink.org/5832. (n) Relation between the sphere equivalent diameter of axonal varicosities imaged in EM vs. LM for synaptic (red, bouton) and non-synaptic (black) varicosities. (o) Likelihood of varicosities to be synaptic (red) vs. non-synaptic (black) over LM varicosity sphere equivalent diameter, computed from the respective (prevalence-weighted, kernel density estimated) probability densities (dashed, see Materials and methods). (p–r) Second FluoEM experiment from upper cortical L1 in S1 cortex (p: LM dataset subvolume corresponding to (q); q: EM high-res dataset with dimensions) and (r) reconstruction effort for LM-to-EM matching of axons (labels as in Figure 5e).

