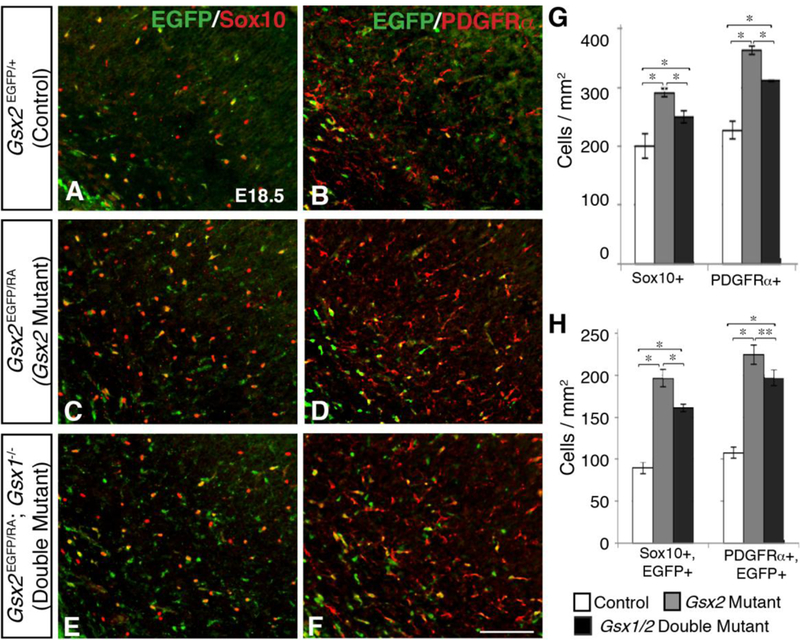
Fig. 3. Increased oligodendroglial specification in Gsx1/2 double mutants does not lead to a further expansion in adjacent cortical OPCs as compared to Gsx2 mutants.

Gsx2 mutants display increased Sox10 (control 203.2±28.7; mutant 290.3±6.4 cells/mm2) and PDGFRa (control 227.4±15.2; mutant 362.6±7.0 cells/mm2) OPCs within the cortex at E18.5 (C-D compared to A-B; G). Gsx1/2 double mutants also exhibit increased cortical Sox10 (258.7±7.8) and PDGFRα (310.8±1.1) OPCs compared to controls (E-F), however Gsx1/2 double mutants have significantly fewer OPCs than Gsx2 mutants (G). When considering only cortical OPCs that originated from G.vx2-expressing progenitors (co-expressing EGFP), Gsx1/2 double mutants again generated significantly more Sox10 (control 89.5±6.9; double mutant 161.0±4.5 cells/mm2) and PDGFRα (control 107.8±6.6; double mutant 196.8±9.3 cells/mm2) OPCs than controls, yet significantly fewer than Gsx2 mutants (196.6±10.5 Sox10+ cells/mm2; 224.5±11.6 PDGFRα+ cells/mm2) (H). Both Gsx2 mutants and Gs1/2 double mutants contained significantly more Gsx2-derived OPCs within the cortex, indicating that the vast majority of increased OPCs arose from Gsx2 mutant progenitors (H). Data represent the mean ±SEM. *p<0.01 and **p<0.05, as determined by a one-way ANOVA followed by a Tukey HSD post- hoc test. Scale bar: F = 100μM
