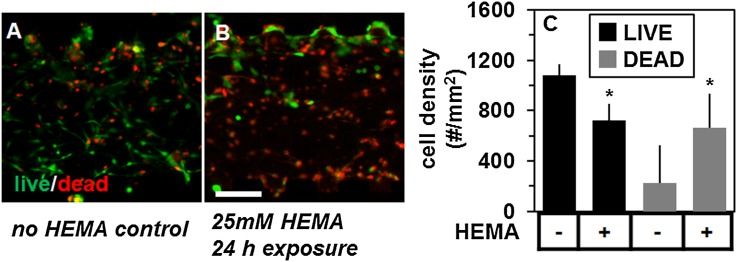
FIG. 6.
The effect of HEMA on layer viability of the mucosa-on-a-chip. Merged epifluorescence micrographs of calcein AM (live, green) and ethidium homodimer (dead, red) signal (a) before and (b) after 24 h exposure to 25 mM soluble HEMA from the apical (top) channel. (c) The density of live and dead cells counted within each condition. The (*) symbol indicates group differences by Student’s t-test, at p < 0.05. The scale bar is indicated.

