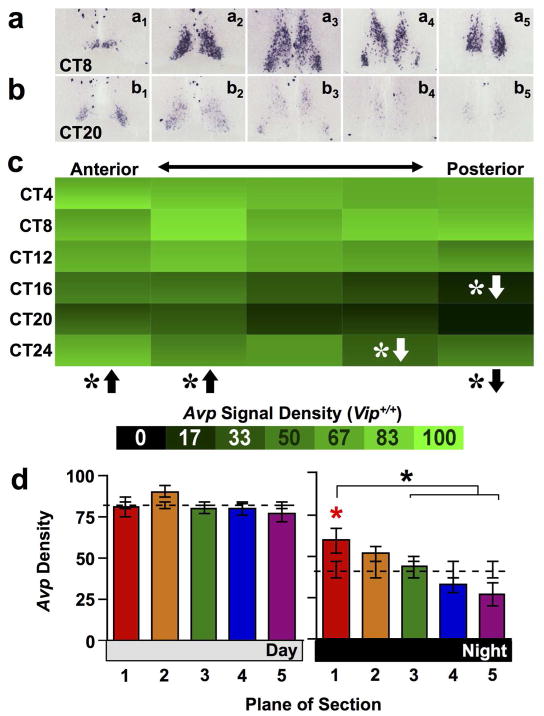
Figure 1. Avp expression across the anteroposterior SCN in wild type mice.
a–b) Representative slices illustrating Avp expression across the anteroposterior SCN in wild type mice. Subscript indicates plane of section from Plane 1 (most anterior) to Plane 5 (most posterior). Images for each circadian time (CT) illustrate the times of peak and trough expression. c) Heat maps illustrating temporal patterns of Avp expression for each plane of section 1–5, corresponding to plane of section in the raw images immediately above (n = 3 slices per circadian time point for each plane). For each cell, variance is encoded as a vertical color gradient depicting +/− SEM. White asterisks with directional arrows indicate that Avp expression in that plane of section was higher (up arrow) or lower (down arrow) density relative to the Whole SCN at that circadian time point. LSM Contrasts: * p < 0.01. Black asterisks with directional arrows below heat maps indicate that Avp expression in that plane of section differed from Whole SCN across the 24-hour cycle overall. LSM Contrasts: * p < 0.05. d) Normalized Avp expression (Mean ± SEM) during subjective day (CT04-CT12) and subjective night (CT16-24) across the anteroposterior SCN (n = 9 slices per time bin per plane). Dashed line indicates average density for the Whole SCN. Asterisks with brackets indicate differences among SCN planes- Tukey’s HSD, * p < 0.05. Asterisks located immediately above bars (color-coded in online version) indicate SCN planes that differ from Whole SCN- LSM Contrasts * p < 0.01.

