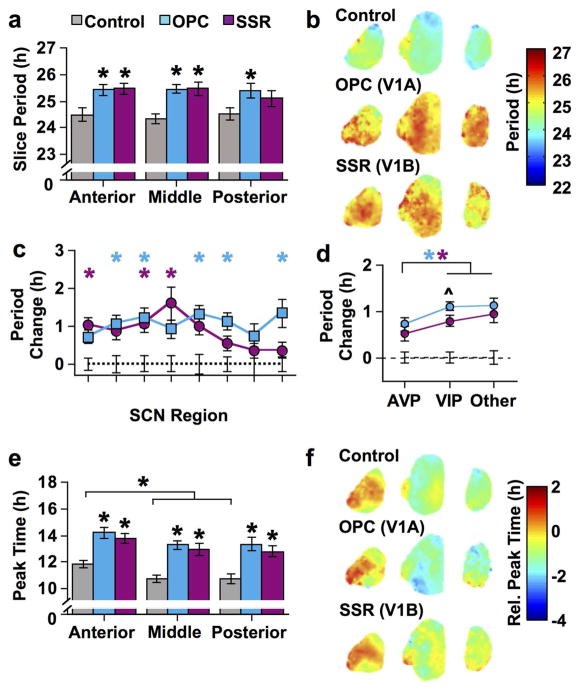
Figure 12. Signaling through V1A and V1B AVP receptors influences SCN period and phase.
a) Average period (± SEM) in vitro of SCN slices. b) Average period maps for each group (color-coded in online version). c) Average change in cellular period (± SEM) relative to control conditions (dashed line at 0) in different SCN regions. d) Average change in cellular period (± SEM) relative to control conditions (dashed line at 0) across neurochemically-distinct regions. Regions used for each neurochemical group are AVP: 1, 4, 7, 8, Other: 2, 5, VIP: 3, 6. e) Average ZT peak time (± SEM) in vitro of SCN slices. f) Average phase maps for each group (color-coded in online version). For a & e) * p < 0.01; + p < 0.05. For c–d) * p < 0.01 different from control (color-coded in online version to represent specific antagonist group); ^ p < 0.01 difference between V1A and V1B antagonists; n = 7–8 slices per group for each plane. Note that small error bars may be obscured by symbols.

