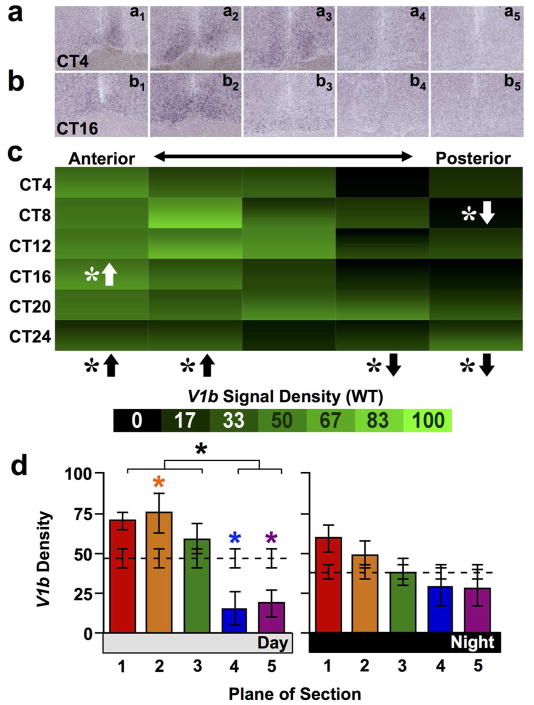
Figure 4. V1b expression across the anteroposterior SCN in wild type mice.
a–b) Representative slices illustrating V1b expression. c) Heat maps illustrating temporal patterns of V1a expression. n = 3–4 slices per circadian time point for each plane. d) Normalized V1a expression (Mean ± SEM) during subjective day (CT04-CT12) and subjective night (CT16-24) across the anteroposterior SCN. n = 11–12 slices per group per plane. Other conventions as in Figure 1.

