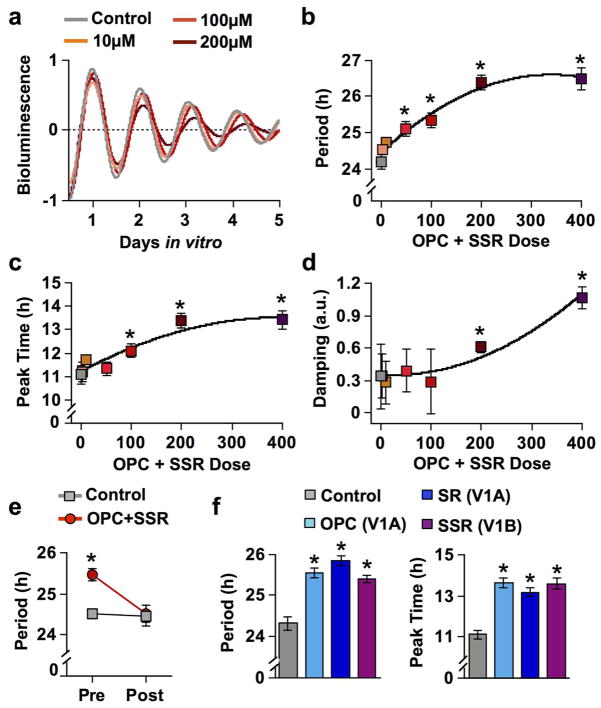
Figure 9. V1 antagonism lengthens SCN period and delays phase in a dose-dependent manner.
a) PER2::LUC rhythms of SCN slices at different doses of OPC+SSR. b) Dose response curve of average period length (± SEM) of SCN slices in vitro. c) Dose response curve for average ZT peak time (± SEM) of SCN slices in vitro. d) Dose response curve for rhythm damping (± SEM) in SCN slices in vitro. e) Period length of SCN slices cultured with 100μM OPC+SSR or vehicle control before (pre) and after (post) medium exchange to washout drugs. f) Period length and peak time of SCN slices cultured with vehicle control or 100μM single receptor antagonists: OPC (V1A), SR (V1A), or SSR (V1B). LSM Contrasts *p < 0.01 different from control; n = 4–9 slices per group. Note that small error bars may be obscured by symbols.

