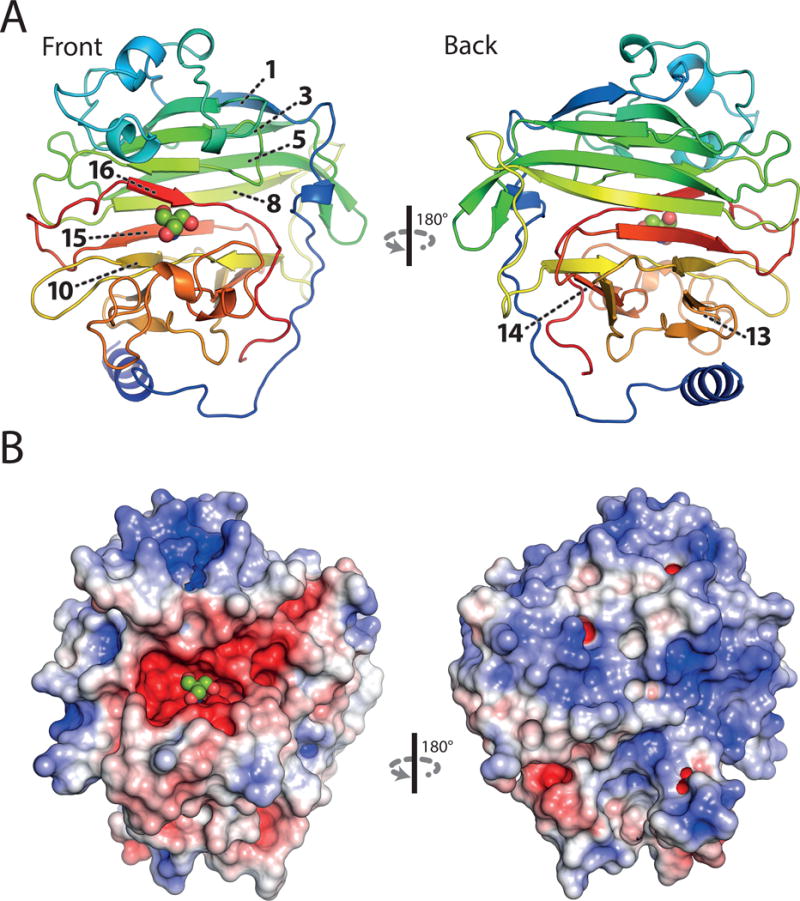
Figure 2.

Crystal structure of the adhesion domain PrgB246-558 at 1.6 Å resolution. A: Ribbon representation, coloured in rainbow. The numbers of individual β-strands important for protein function are indicated. B: Surface charge distribution calculated by APBS, scaled from -5 (red) to 5 (blue) kbT. A bound Tris-molecule within the negatively charged cleft is shown in spheres. The top and back side of the protein is dominated by positively charged surface areas.
