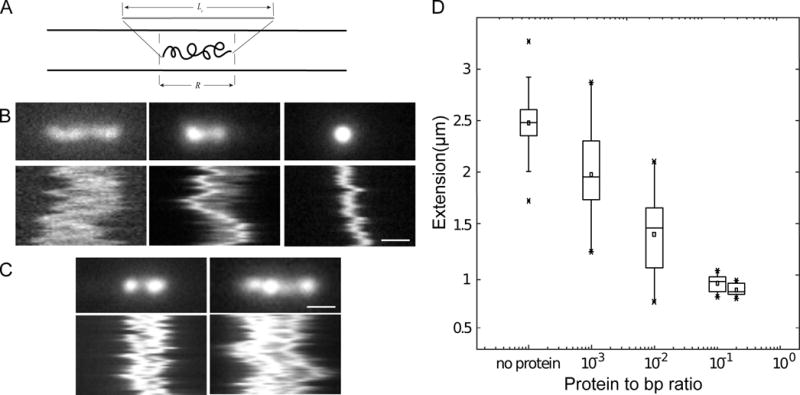
Figure 5.

Nanochannel experiments with DNA and dimeric PrgB. A: A sketch showing a DNA molecule confined inside a nanochannel. DNA will be partially stretched out in the nanochannel, with an extension R, shorter than its contour length, Lc. B: Snapshots and kymographs of λ-DNA with PrgB bound confined in 800×150 nm2 channels. i) non-compacted DNA. ii) partly compacted DNA. iii) fully compacted DNA. C: Snapshots and kymographs of λ-DNA molecules confined in 800×150 nm2 channels. Left: Partially compacted DNA with two ends condensed. Right: DNA dimer with three condensed points. D: Boxplot of extension of λ-DNA inside 800×150 nm2 channels. The box is determined by the 25th and 75th percentiles and the whiskers are determined by the 5th and 95th percentiles. The line in the box is the median value and the square symbol in the box is the mean value. The cross symbols are the maximum and minimum values, respectively. The DNA concentration is 5 μM base pairs. The scale bar is 1μm in all figures.
