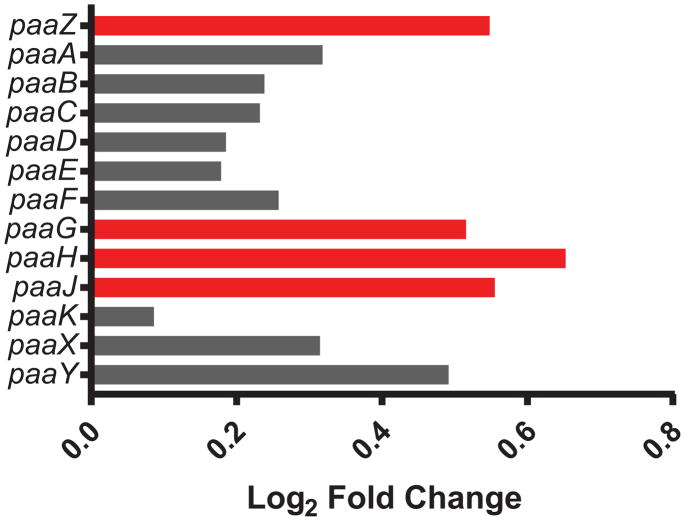
Figure 2. Differential expression of genes within the phenylacetic acid catabolism pathway in the PgAb communities compared to Ab alone.
Results are expressed as log2 fold change in the PgAb community compared to Ab alone. Higher mRNA levels are represented as red bars and those with no significant change are shown as gray.

