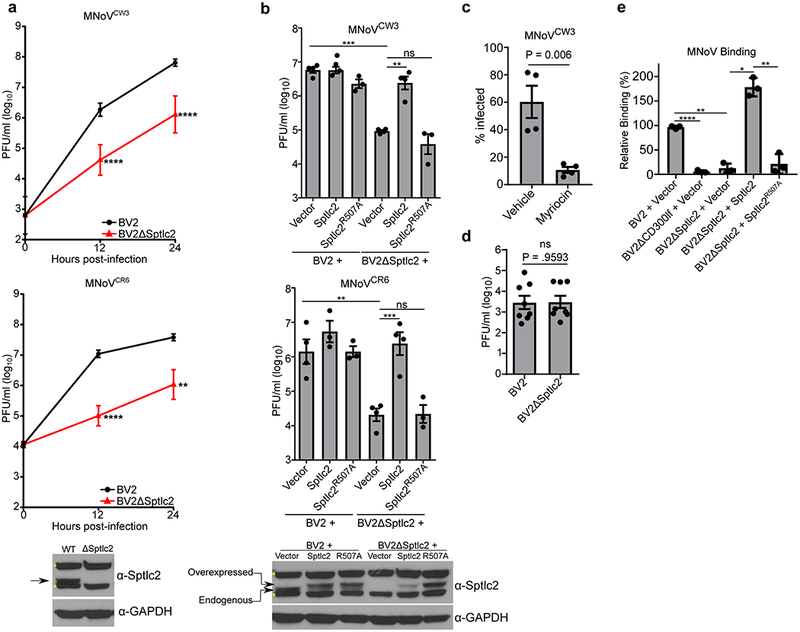
Figure 1: de novo ceramide biosynthesis is required for efficient MNoV infection, binding, and entry.

(a) BV2 or BV2ΔSptlc2 cells were challenged with MNoV at a multiplicity of infection (MOI) of 0.05 with strains MNoVCW3 (Top) or MNoVCR6 (Bottom). Viral production was measured using plaque assay (PFU; plaque forming units) at indicated time points. Time point 0 represents input inoculum. Below is a representative western blot for indicated proteins. Arrow indicates expected molecular weight and asterisks denote non-specific bands. Data are shown as means ± SEM from three independent experiments and data were analyzed by unpaired two-sided t-test. **p<0.01, ****p<0.0001.
(b) Wild type BV2 or BV2ΔSptlc2 cells expressing either an empty vector, Sptlc2, or Sptlc2R507A were challenged with MNoV at a multiplicity of infection (MOI) of 0.05 with strains MNoVCW3 (top) or MNoVCR6 (bottom). Viral production was measured using plaque assay at 12 hours post-infection. Results are shown are means ± SEM from three independent experiments and data were analyzed by one-way ANOVA with Tukey’s multiple comparison test. ns, not significant; *p<0.05, **p<0.01, ***p<0.001, ****p<0.0001. Below is a representative western blot from complementation experiment in for indicated proteins. Arrow indicates expected molecular weight and asterisks denote non-specific bands.
(c) MNoVCW3 infection of BV2 cells treated with vehicle (Methanol) or DMSO or Myriocin (25 μm) 24 hours prior to challenge. Infection was measured by FACS for intracellular production of VP1. Data are shown as means ± SEM from four independent experiments and data were analyzed by unpaired two-sided t-test
(d) BV2 or BV2ΔSptlc2 cells were transfected with viral RNA from MNoVCW3 and harvested 12 hours post-transfection. Viral production was measured by plaque assay. Data are shown as means ± SEM from three independent experiments and data were analyzed by unpaired two-sided t-test; ns = not significant
(e) Indicated cell lines were assayed for MNoVCW3 binding using quantitative polymerase chain reaction and normalized to the median of BV2 + Vector for each experiment. Data are shown as means ± SEM from three independent experiments and data were analyzed by one-way ANOVA with Tukey’s multiple comparison test. *p<0.05, **p<0.01, ***p<0.001, ****p<0.0001.
