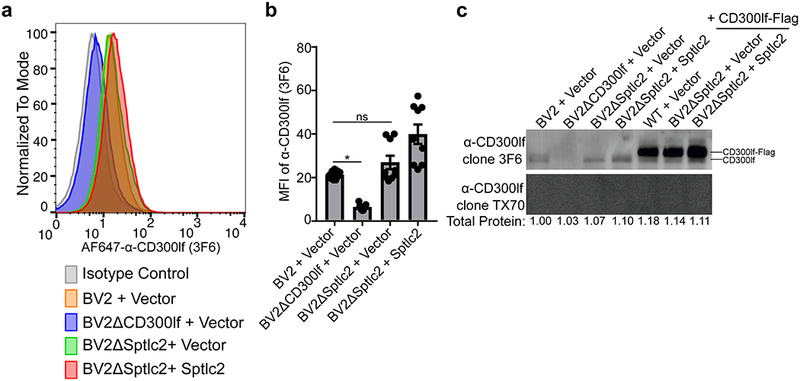
Figure 2: Sptlc2 is not required for CD300lf surface localization.

(a) Histogram of a representative FACS experiment from three independent experiments looking at the CD300lf surface levels using AF647-α-CD300lf antibody 3F6 with indicated cell lines.
(b) Quantification of mean fluorescence intensity (MFI) of α-CD300lf antibody 3F6 from three independent experiments. Data are shown as means ± SEM from three independent experiments and data were analyzed by one-way ANOVA with Tukey’s multiple comparison test. *p<0.05, ns = not significant.
(c) A representative western blot of indicated cell lysates with CD300lf antibodies 3F6 (4 μg/ml, top) and TX70 (4 μg/ml, bottom). Below each lane is listed the total protein measured in each lane relative to WT + Vector. The inability of TX70 to recognize CD300lf when overexpressed by western blot but is able to recognize CD300lf by FACS indicates that the molecule is conformation dependent. Data is representative of three independent experiments.
