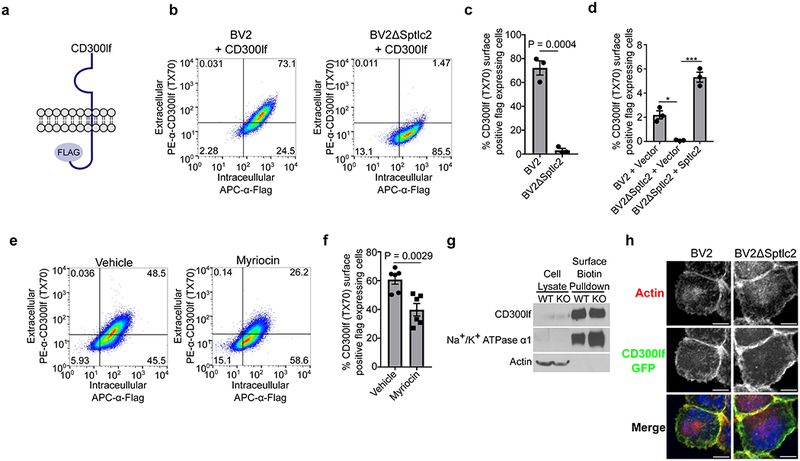
Figure 3: Ceramide biosynthesis is required for a functional CD300lf conformation.

(a) Cartoon diagram of the CD300lf-Flag construct used. Data are representative from three independent experiments.
(b) FACS plots of indicated cells stained first with the conformational dependent antibody PE-α-CD300lf antibody TX70 (y-axis) prior to intracellular staining of APC-α-Flag (x-axis).
(c) Quantification of the percentage of α-CD300lf antibody TX70 positive pCDH-CD300lf-Flag-T2A-Puromycin transduced cells that express Flag for the indicated cells. Data are shown as means ± SEM from three independent experiments and data were analyzed by unpaired two-sided t-test
(d) Quantification of percentage of α-CD300lf antibody TX70 positive pCMV-CD300lf-Flag-P2A-Blasticidin transduced Sptlc2 complemented cells that express Flag. Data are shown as means ± SEM from three independent experiments and data were analyzed by one-way ANOVA with Tukey’s multiple comparison test. *p<0.05, ***p<0.001, ns = not significant
(e) FACS plots of pCDH-CD300lf-T2A-Puromycin cells treated with vehicle or myriocin for 24 hours prior to staining with the conformational dependent antibody PE-α-CD300lf antibody TX70 (y-axis) prior to intracellular staining of APC-α-Flag (x-axis). Data are representative from three independent experiments.
(f) Quantification of the percentage of α-CD300lf antibody TX70 positive pCDH-CD300lf-T2A-Puromycin transduced cells that express Flag for the indicated treatments. Data are shown as means ± SEM from three independent experiments and data were analyzed by unpaired two-sided t-test
(g) Representative western blot of whole cell lysate (left) or purified cell surface biotinylated proteins (right) in BV2 or BV2ΔSptlc2 cells overexpressing CD300lf-FLAG. Na+/K+ ATPase α1 (cell surface) and actin (intracellular) are used as controls. Data are representative from three independent experiments.
(h) Representative microscopy images of BV2 or BV2ΔSptlc2 expressing a CD300lf-Flag-GFP (green) transgene. Cells were stained with AlexaFluor594-Phalloidin (red) to illustrate the outline of cell and DAPI (Blue) to highlight the nucleus. Scale bar represents 10 μm. Data are representative from three independent experiments.
