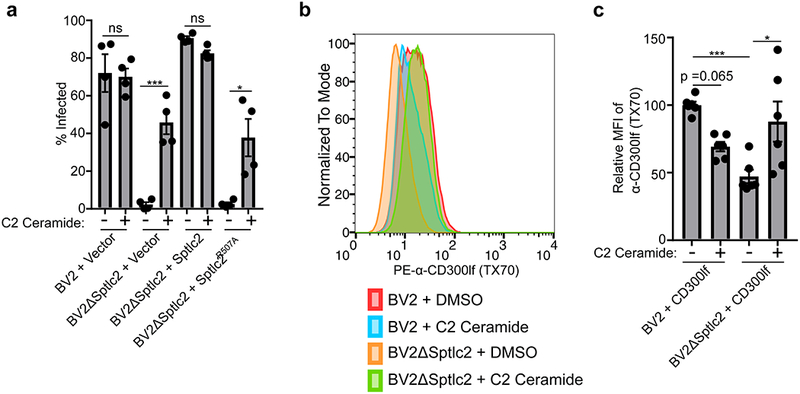
Figure 4: Chemical complementation restores MNoV infection and a CD300lf conformation in Sptlc2 deficient cells.

(a) MNoVCW3 infection of indicated cell lines either treated with DMSO or C2 ceramide. Infection was measured by FACS for intracellular production of VP1. Data are shown as means ± SEM from three independent experiments and data were analyzed by one-way ANOVA with Tukey’s multiple comparison test. *p<0.05, ***p<0.001, ns = not significant.
(b) Histogram of a representative histogram from three independent experiments looking at the CD300lf conformation-dependent antibody TX70 ability to stain indicated cells treated with either DMSO or C2 ceramide.
(c) Quantification of mean fluorescence intensity (MFI) of α-CD300lf antibody TX70 from three independent experiments. MFI within an experiment was normalized to BV2 + DMSO. Data are shown as means ± SEM from three independent experiments and data were analyzed by one-way ANOVA with Tukey’s multiple comparison test. *p<0.05, ***p<0.001, ns = not significant.
