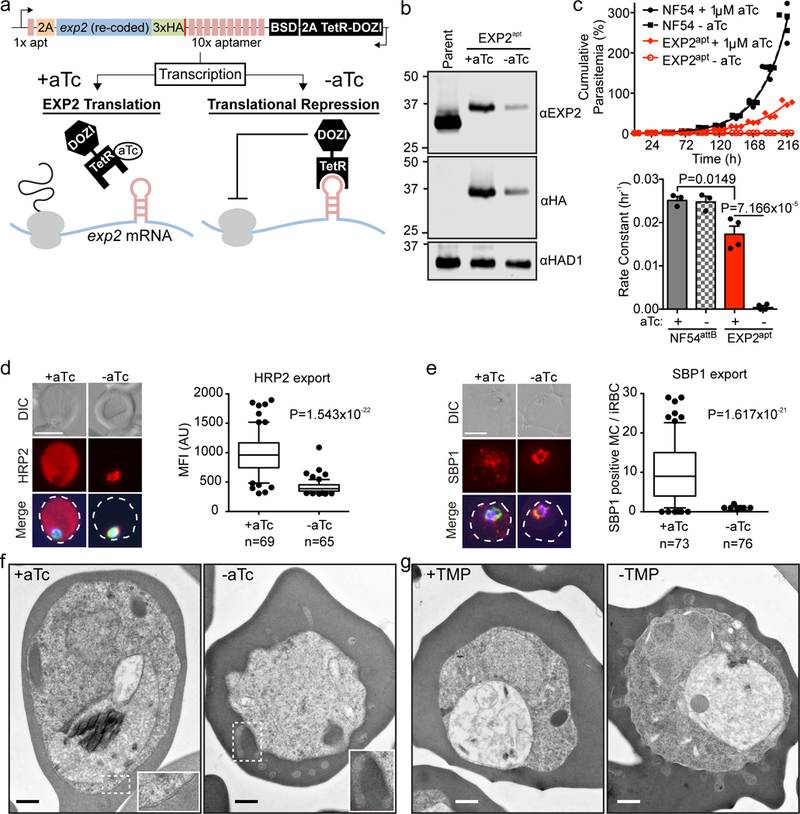
Figure 1. EXP2 is essential for blood stage survival and protein export.

a, Schematic of TetR-DOZI-aptamers strategy for conditional translational repression of EXP2. 2A, thosea asigna virus 2A skip peptide; HA, haemagglutinin tag; BSD, blasticidin-S deaminase; TetR-DOZI, Tetracycline repressor-DOZI fusion. b, Western blot of parental NF54attB - aTc and EXP2apt parasites +/− aTc for 48 h. The cytosolic haloacid dehalogenase-like hydrolase protein HAD1 serves as a loading control. Predicted molecular weights after signal peptide cleavage: EXP2: 30.8 kDa; EXP2–3xHA: 34.1 kDa. Results are representative of three independent experiments. EXP2 levels are reduced to 42.74±9.49% +aTc and 6.49±3.95% -aTc relative to the parental line. Uncropped western blots are shown in Supplementary Fig. 11. c, Growth analysis of NF54attB and EXP2apt parasites +/− aTc. Results from one experiment with three technical replicates are shown and are representative of multiple independent experiments. Bar graph shows mean exponential growth rate constants (hr−1) derived from the fit of three (NF54attB) or four (EXP2apt) independent experiments. Error bars indicate s.e.m. d, e, Immunofluorescence assay (IFA) showing export of the Plasmodium Export Element (PEXEL)-containing protein HRP2 (d) and the PEXEL-negative exported protein (PNEP) SBP1 (e) in EXP2apt parasites (bearing a 3xFLAG tag on HSP101) synchronized to a 3 h invasion window and allowed to develop 24 h post invasion +/− aTc. Merge images include (d) Aldolase or (e) HSP101–3xFLAG in green and DAPI in blue. Scale bars, 5 μm. Quantification of HRP2 export to the host cytosol (d) or the number of SBP1-positive Maurer’s Clefts (MC) (e) is shown. Data are pooled from two independent experiments, n is the number of individual parasite-infected RBCs. Boxes and whiskers delineate 25th-75th and 10th-90th percentiles, respectively. All P values determined by an unpaired, two-sided t-test. DIC, differential interference contrast; MFI, mean fluorescence intensity. f, g, PV morphological abnormalities following EXP2 knockdown (f) or HSP101 inactivation (g) visualized by transmission electron microscopy. The phenotype was visualized in three independent experiments by Giemsa stain (Supplementary Fig. 3) and in a single electron microscopy experiment. Scale bar, 500 nm.
