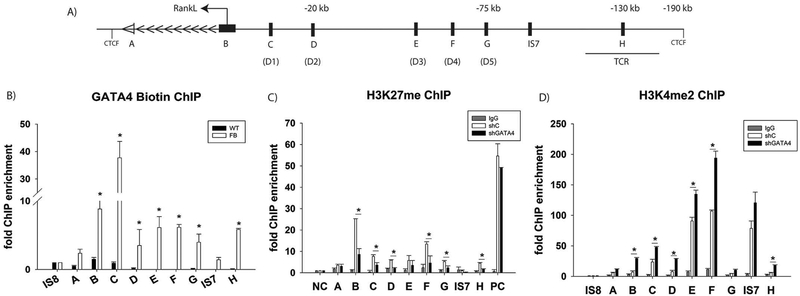
Fig. 5.
GATA4 regulates RANKL at eight different loci. Schematic diagram of the RANKL genomic locus. The arrows indicate the direction of gene transcription. The GATA4 binding sites are denoted A-H. VDR sites are denoted D1-D5. The TCR (T cell control region) and CTCF binding sites are indicated [8]. The distances from the transcriptional start site are marked. (B) ChIP was performed using streptavidin-coated beads with wildtype or Flag-biotin-GATA4 calvarial osteoblasts. qPCR was performed with primers to the indicated regions. (C) Calvarial osteoblasts were transduced with either shC or shGATA4 lentivirus. ChIP was performed with an antibody to H3K27me3 or normal IgG. qPCR was performed to the indicated regions. Each PCR was normalized to input and represented as fold enrichment over Actb. Intergenic sequence 7 (IS7) is a negative control. An additional negative control (NC) and positive control (PC) region were used. N = 3, Student’s t-test: * = P < 0.05. (D) Calvarial osteoblasts were transduced with either shC or shGATA4 lentivirus. ChIP was performed with an antibody to H3K4me2 or normal IgG. qPCR was performed to the indicated regions. Each PCR was normalized to input and represented as fold enrichment over a negative intergenic sequence (IS8). Intergenic sequence 7 (IS7) is a negative control. N = 3, Student’s t-test: *P < 0.05; **P < 0.01, ***P < 0.001.

