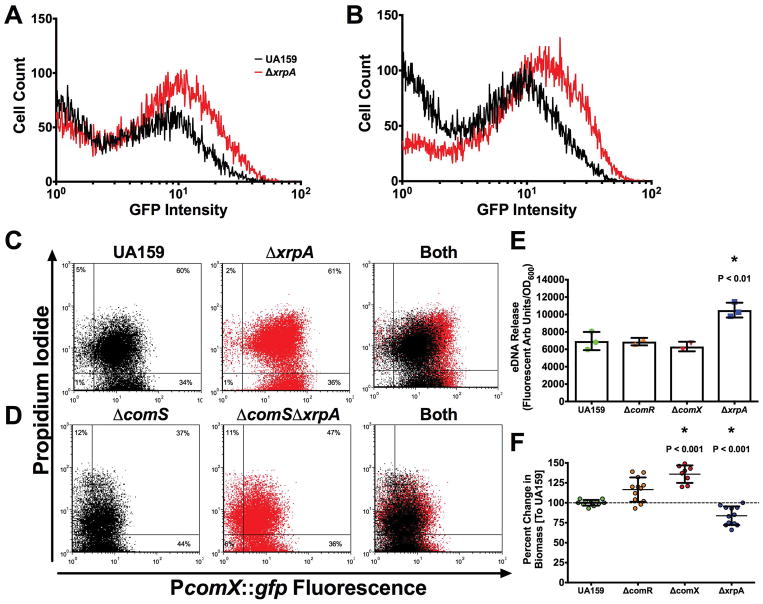
Figure 3. XrpA changes subpopulation behaviors.
Histogram of cell counts from flow cytometry analysis of the PcomX::gfp reporter strain in UA159 (black lines) or ΔxrpA (red lines) grown in BHI with addition of either (A) 100 nM or (B) 1000 nM sCSP. For experiments with FMC and addition of 2 μM sXIP, reporter strains in either (C) UA159 or (D) ΔcomS background were stained with propidium iodide before analysis. A total of 50,000 cells were counted in three independent replicates for each experiment. (E) eDNA release of selected strains from three independent overnight cultures grown in CDM media. eDNA release was calculated by taking the arbitrary fluorescent units and dividing by the recorded OD600 at the time of harvest. (F) Change in biofilm biomass compared to UA159 using CDM media with 15 mM glucose and 2.5 mM sucrose as the carbohydrate source after 48 hours of growth. Each data point (n = 12 or n = 8) represents an individual replicate. Statistical analysis was calculated by the Student’s t-test; * P < 0.01.

