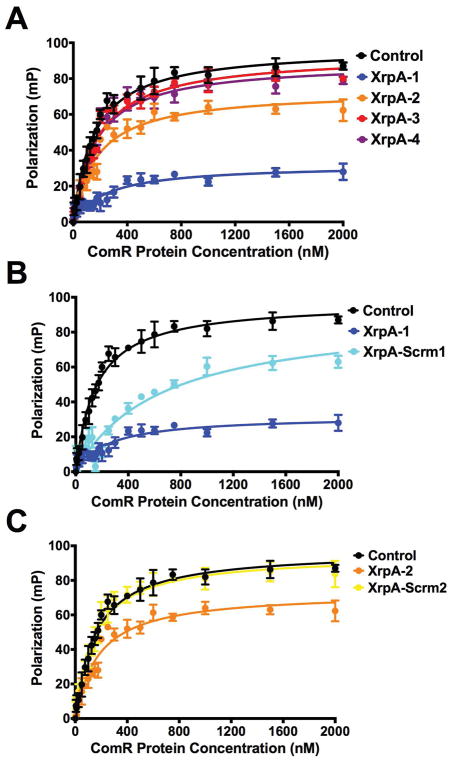
Figure 6. Fluorescence Polarization confirms XrpA-ComR interactions.
Fluorescence polarization (FP) curves of increasing concentrations of purified ComR binding to 10 nM of PcomX dsDNA probe in the presence of 10 μM sXIP and 10 μM of various XrpA peptides (Figure 4A). Control (black lines) represent binding in the absence of XrpA peptides. (A) addition of XrpA peptides 1–4, (B) comparison between XrpA-1 and a scrambled version of XrpA-1, and (C) comparison between XrpA-2 and a scrambled version of XrpA-2. Data shown are averages from three independent experiments. Kd values are shown in Table 2.

