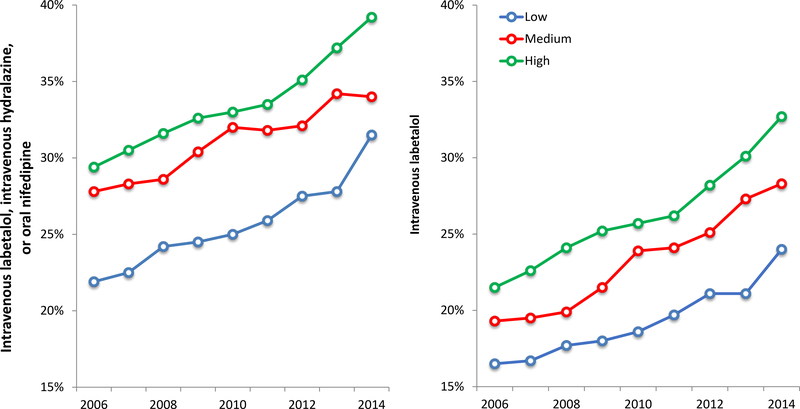
Figure 3. Proportion of preeclamptic patients receiving antihypertensives based on hospital volume.
Legend: The figure demonstrates the proportion of patients with a preeclampsia diagnosis receiving antihypertensives by hospital volume category: low (≤1000 deliveries per year), medium (1001 to 2000 deliveries per year), and high volume (>2000 deliveries per year).

