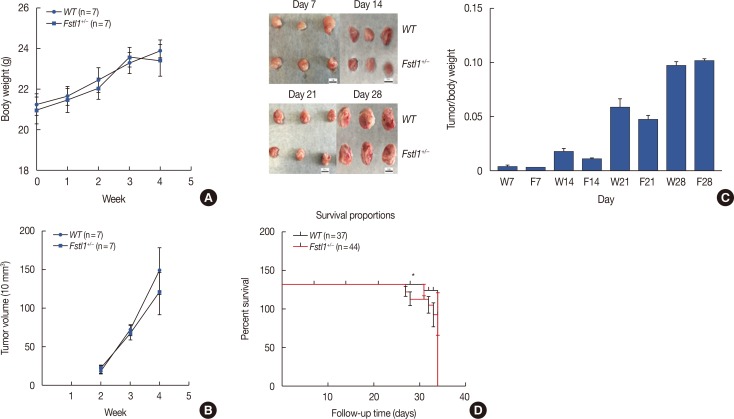
Figure 3. Growth of primary 4T1 tumors in wild type (WT) and Fstl1+/−mice. (A) Body weight was monitored in WT and Fstl1+/−mice for 4 weeks after the injection of 4T1 cancer cells (n=7). (B) Tumor volume was measured for 3 weeks (n=7). (C) The dissected tumors at day 7, 14, 21, and 28 (n=3). Tumors were dissected, and their weights and tumor volumes were measured. (D) Survival analysis of WT (n=37) and Fstl1+/−mice (n=44). Each bar represents the mean±SD for triplicate experiments.
W=WT; Fstl1+/−. *p<0.05, unpaired t-test.

