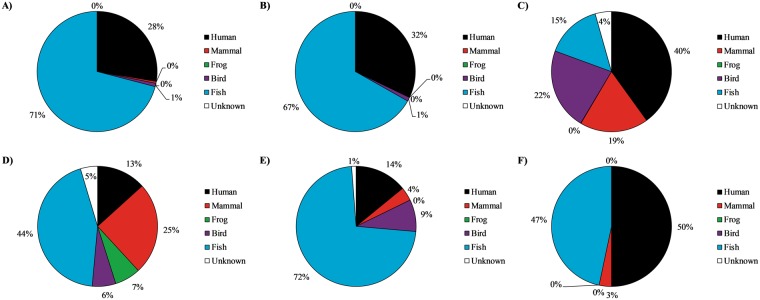
Figure 4.
Percentage of sequences detected during dry sampling days in (A) Etobicoke Creek, (B) Marie Curtis Beach and (C) stormwater outfalls, and after the extreme rain event on July 9th in (D) Etobicoke Creek, (E) Marie Curtis Beach and (F) stormwater outfalls. Percentages were calculated per sample type based upon the combined sequences of the drier sampling events compared to the percentages obtained following the extreme rain event.

