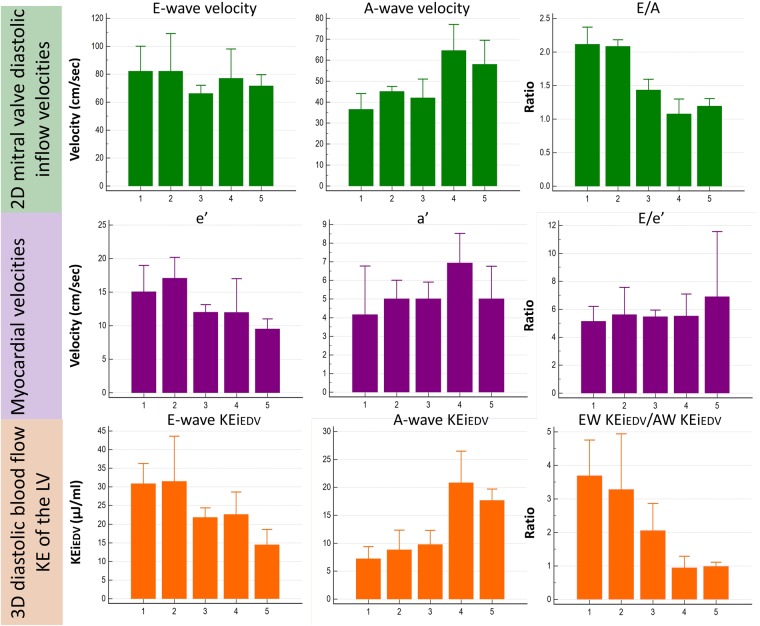
Figure 1.
Bar chart displaying the reference values for 4D diastolic LV blood flow KE parameters along with myocardial velocities and 2D mitral valve diastolic inflow velocities. Advancing age is denoted on the x-axis, with the study population divided into groups (1–5). Group 1 = 23 ± 2 years old (n = 12), group 2 = 32 ± 3 (n = 9), group 3 = 47 ± 4 (n = 11), group 4 = 54 ± 2 (n = 10), group 5 = 69 ± 6 (n = 11). For the 2D mitral inflow velocities and myocardial velocities, the velocity (in cm/s) is given on the y-axis with errors bars denoting standard deviation (SD), whereas for 4D diastolic blood flow KE parameters, energy in μJ/ml is given, with error bars denoting interquartile range (IQR).

