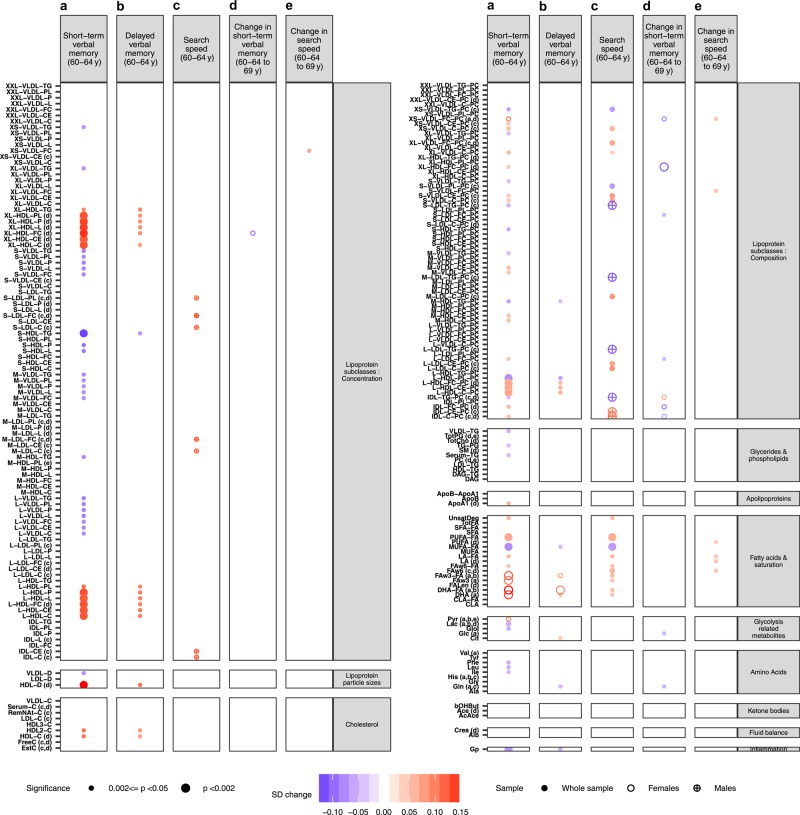
Fig. 3. Linear regression analyses results for the associations between all metabolite measures and cognitive outcomes.
a Short-term verbal memory, b delayed verbal memory and c search speed at 60–64 years; d change in short-term verbal memory and e change in search speed between 60–64 and 69 years for Model 1. Small circles represent associations at 0.002<=p < 0.05 and large circles at p < 0.002. Colours represent the association magnitudes are indicated in units of 1 SD metabolite concentration per 1 SD of each cognitive outcome. (a–e) An interaction between metabolite and sex at p < 0.1 for each outcome in which case sex-stratified analyses are performed for the respective outcome. Full circles represent sex-adjusted analyses performed in the whole sample and hollow and crossed circles represent analyses performed in females and males respectively in the case of an interaction with sex. The full names of the metabolite measures can be found in Supplementary Table S1

