Fig. 1.
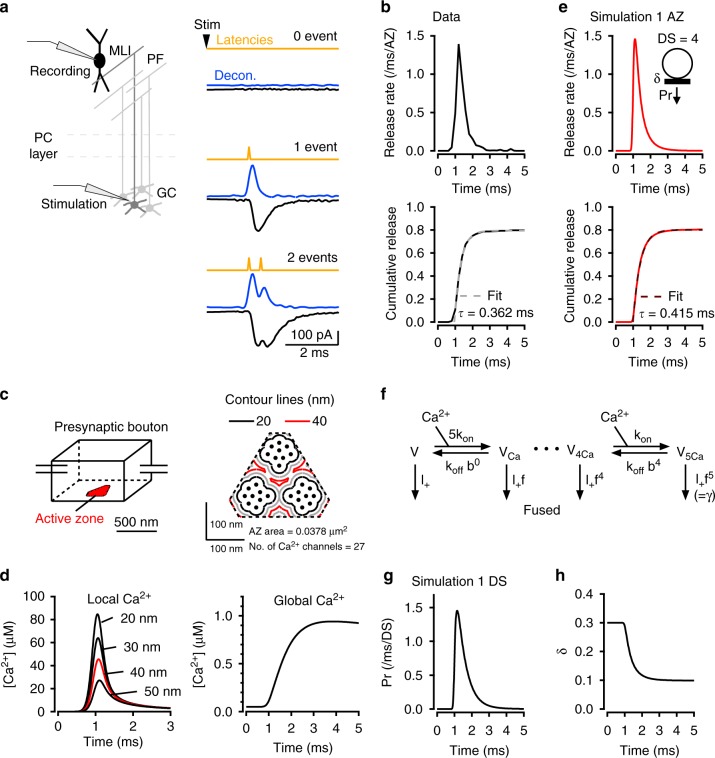
Fast latency distribution following single AP stimulation. a Schematics of recording conditions. Representative recordings from a simple PF-MLI synapse, showing individual EPSC responses (black) to presynaptic AP stimuli (stim), deconvolved traces using quantal EPSC as kernel (blue), and calculated latencies obtained by analysis of deconvolved traces (yellow). b Upper panel: Release rate for individual simple synapses (average from n = 17 synapses). Lower panel: Corresponding cumulative histogram, with superimposed exponential fit. c Schematic representation of presynaptic PF bouton, as used for the calculation of [Ca2+] profiles. The AZ has a roughly triangular shape and contains three clusters of VGCCs. SV release occurs near contour lines at a 40 nm distance from VGCC cluster edges (red). d Calculation of [Ca2+] profiles averaged over the contour lines shown in c (left; max. [Ca2+] = 45.6 μM at 40 nm distance shown in red), as well as in more distant locations (>100 nm: right; max. [Ca2+] = 0.9 μM). e Based on the local [Ca2+] profile at 40 nm distance, the calculated release rate per simple synapse (with 4 docking sites, an initial docking site occupancy of 0.3, and no replenishment) peaks near 1.5 ms−1 (or 1500 s−1; upper panel), with a cumulated release probability near 0.8 (lower panel). f Allosteric model used for estimation of release rate with following parameters: Kon = 5 × 10⁸ M−1 s−1, Koff = 5000 s−1, b = 0.75, γ = 2100 s−1, f = 31.3 (see Methods). g Calculated release rate per occupied docking site, based on global [Ca2+] profile in d and on allosteric model in f. h The simulated time course of docking site occupancy, starting from the resting value δ = 0.3. Here no SV replenishment is assumed, so that δ reaches a steady-state value (near 0.1). More complete simulations suggest that δ rebounds after a few ms as shown below

