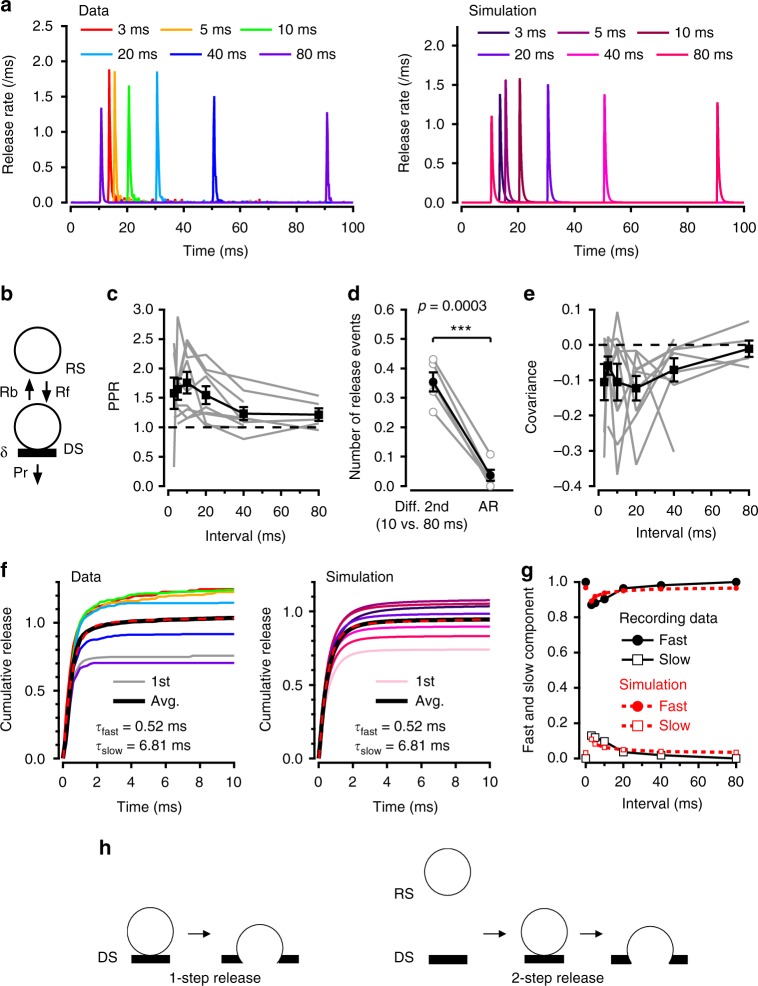
Fig. 2.
Facilitation and slow latency component in paired stimulation experiments. a Pairs of APs with variable inter-AP intervals (from 3 to 80 ms) were applied cyclically (with 10 s intervals between pairs), and release rates were calculated per AZ. Averaging across experiments indicates a transient facilitation peaking near 10 ms and decaying back to control over 80 ms (left). Right: Corresponding simulation. b Model of docking/undocking processes for four docking sites per AZ, where each docking site (DS) is associated with a replacement site (RS), with docking rate Rf and undocking rate Rb. c Experimental PPR values (where PPR is calculated from the mean numbers s1 and s2 of released SVs for the two stimuli) for nine experiments (black squares: mean ± sem; grey: individual experiments). d Asynchronous release cannot account for facilitation recovery. In each experiment, the difference between mean SV numbers observed after 10 vs. 80 ms was larger than the amount of asynchronous release occurring 10–80 ms after one AP, showing that the recovery of δ cannot be explained on the basis of delayed exocytosis (Pr in scheme b). Error bars show sem (grey: individual experiments; n = 5). Two-tailed paired t test, t(4) = 12.1, ***p < 0.001. e Covariance between s1 and s2, as a function of inter-AP interval. f Cumulative plots of experimental (left; average of nine experiments) and simulated (right) latencies for first latencies as well as for second latencies with different inter-AP intervals (colour code as in a). Note that facilitation is accompanied with the appearance of a secondary slow latency component. Average data of first and all second responses are fitted in both experimental and simulated distributions with the sum of two exponentials with time constants τfast and τslow. g Plot of τfast and τslow component amplitudes as a function of inter-AP interval (black: experimental; red: simulation). h Two different SV release modes. Left: 1-step release shows the classical view of release of a docked SV following AP stimulation. Right: 2-step release shows a rapid sequence of docking (RS → DS) and release following a single AP

