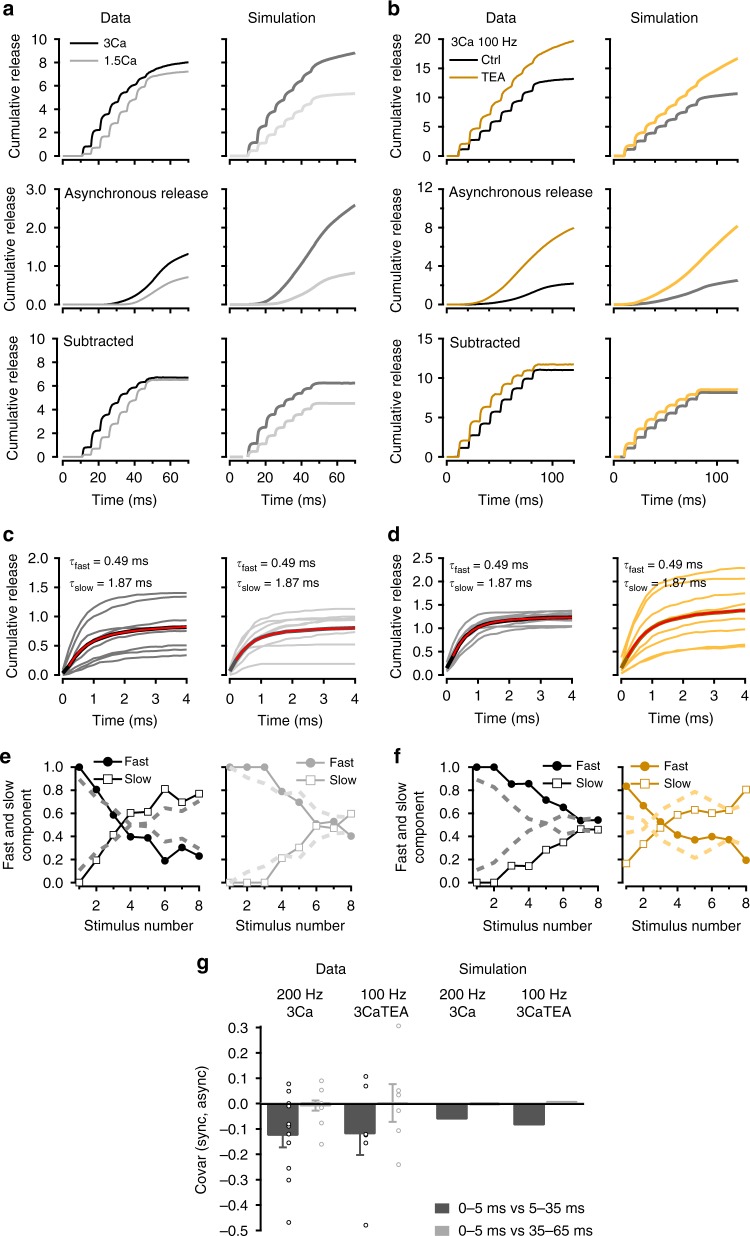
Fig. 4.
Modifications of release by stimulation frequency, external [Ca2+] and TEA. a, b Effects of various experimental manipulations on cumulative latency counts during trains. Overall latency counts (upper row) have been decomposed into a superslow component representing asynchronous release (middle row) and a phasic component (lower row). a Comparison between 1.5 and 3 mM external [Ca2+] (200 Hz stimulation in each case). b Comparison between control recordings (3 mM external [Ca2+] and 100 Hz stimulation) and test recordings obtained after adding 1 mM TEA to increase release probability. c, d Superimposed cumulative latency distributions for each AP stimulation during an 8-AP train, both for control data (left plots in each condition) and for test data (right plots). Average traces of 8-AP responses (thick black curves) are fitted with a double exponential (red) with the indicated τfast and τslow values. c Left: 3 mM external [Ca2+], 200 Hz stimulation. c Right: 1.5 mM external [Ca2+], 200 Hz stimulation. d Left: 3 mM external [Ca2+], 100 Hz stimulation. d Right: As in left, after adding 1 mM TEA. e, f Relative contributions of τfast and τslow component as a function of stimulus number (symbols and continuous lines: experimental; dashed lines: simulations). e 3 mM external [Ca2+] (left) vs. 1.5 mM external [Ca2+] (right); 200 Hz stimulation in both cases. f Control (left) vs. 1 mM TEA (right); 100 Hz stimulation in both cases. g Covariance analysis suggests that last phasic SV release shares the same pathway as later asynchronous release (left: experimental; right: simulation). Error bars show ± sem from 11 experiments for 200 Hz 3 Ca and 6 experiments for 100 Hz 3 Ca TEA (open circles: individual experiments)

