Fig. 5.

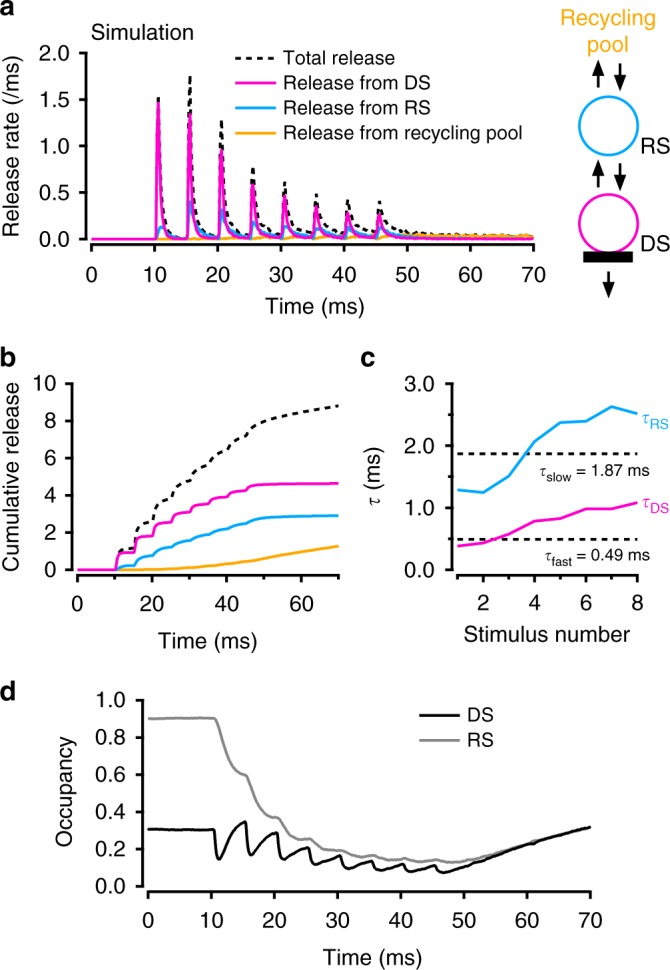
Three modes of SV release during an AP train. Monte Carlo simulations were used to trace back each released SV to its status immediately before the last AP preceding release. The simulations used a modified 2-step model incorporating inhibition of release linked to previous synapse history (Supplementary Fig. 6). a Having sorted out each release SV according to its status just before the AP preceding release, the total histogram of release latencies (dashed line) was decomposed into release from docking site (red), release from replacement site (blue; note slower time course of this component) and release from recycling pool (yellow). b Cumulated plots from a. c Monoexponential fits of the red and blue components in b yield time constants τDS (red) and τRS (blue). Dotted lines indicate the values of τfast and τslow for comparison. This suggests that τfast and τslow correspond to the release of SVs coming, respectively, from docking sites and from replacement sites. In addition, the two-fold increase both in τDS and τRS indicates an increasing participation of slowed release due to previous release activity. d Occupancy of replacement site (ρ) and docking site (δ) during an AP-train
