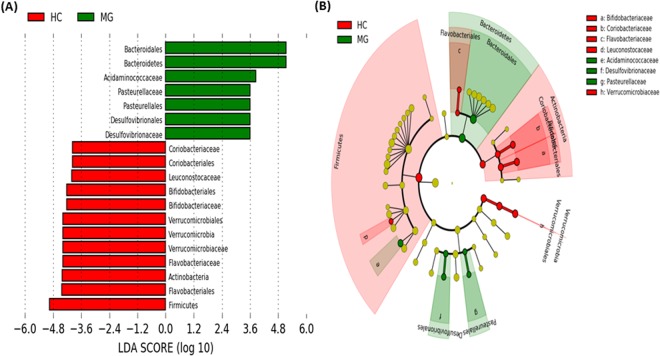
Figure 3.
Linear discriminant analysis (LDA) scores of taxa significantly altered in myasthenia gravis group are shown in (A) (LDA scores > 2 and significance of p < 0·05 as determined by Wilcoxon’s signed-rank test). The most differentially abundant taxa in (red) healthy control (HC) and (green) myasthenia gravis group are represented as a cladogram in (B) that was generated from LDA effect size analysis data in (A). The color intensity of each dot is proportional to its effect size (B).

