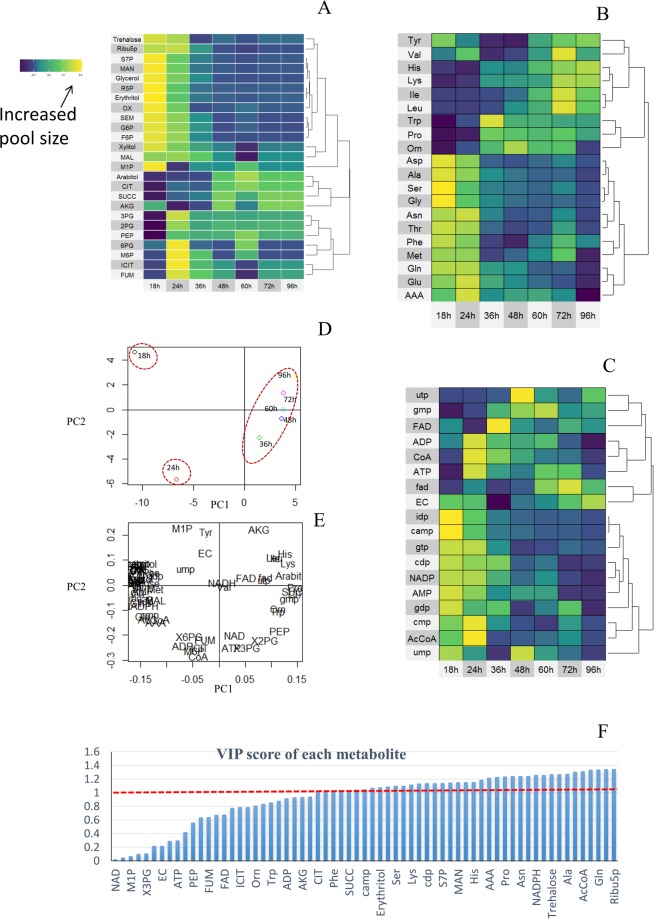
Figure 3.
Data analysis of metabolomics at different fermentation phases (18 h, 24 h, 36 h, 48 h, 60 h, 72 h and 96 h. Heatmap of organic acid and sugar phosphates (A), amino acids (B), nucleotide and coenzymes (C), scores plot for samples in PCA analysis (D), loadings plot for metabolites in PCA analysis (E) VIP score of 69 intracellular metabolites calculated using PLS model (F). The detailed VIP scores for each metabolites can be found in Supplementary File 2.

