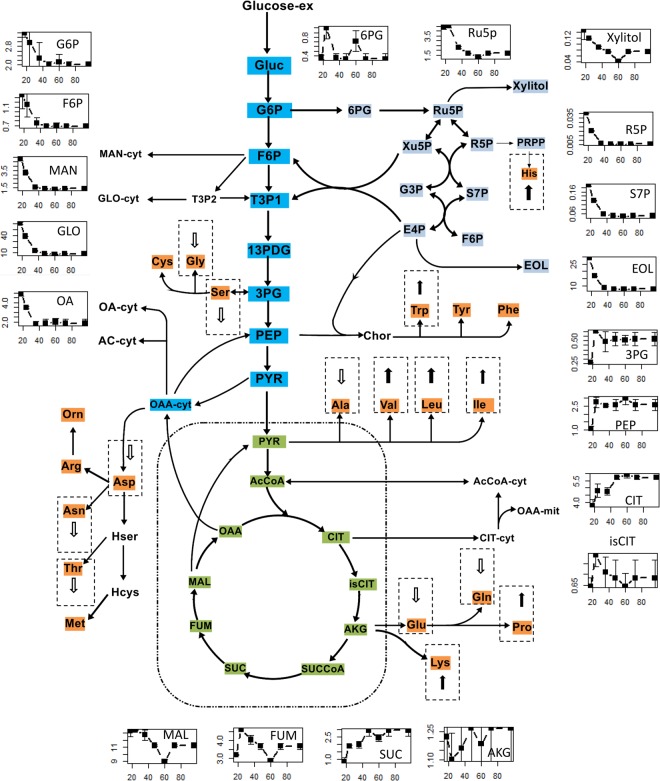
Figure 4.
Schematic representation of the changes in the pool sizes of organic acids, sugar phosphates and amino acids during different fermentation phases onto the core carbon metabolism network. All metabolite pool sizes were determined in at least triplicate measurements. The fermentation time (h) is on the x-axis and the metabolites concentration (μmol/gDCW) is on the y-axis. The arrows in the small gridlines represent the increase or decrease for the pool sizes of intracellular amino acids during the oxygen limited phase compared to that in oxygen excess phase. The detailed profiles of intracellular amino acids pool sizes could be found in Supplementary File 1, Fig. S2.

