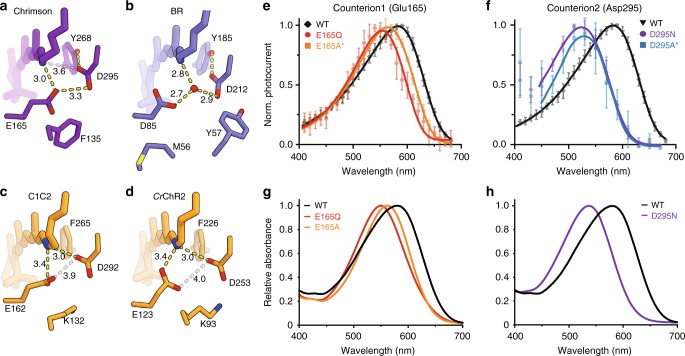
Fig. 3.
Counterion configuration of Chrimson and adjacent residues. a–d Hydrogen-bonding interactions around the protonated Schiff base are shown for Chrimson (a), BR (b), C1C2 (c), and CrChR2 (d). Proposed hydrogen-bonding interactions are indicated by yellow dotted lines, and additional possible interactions with longer distances are indicated by gray lines, with the distance (Å) indicated beside each line. e–h action (e, f) and absorption (g, h) spectra of the counterion residue mutants (Action spectra represent Mean ± SD; n = 5–7; symmetric 110 mM NaCl, pHe,i 7.2 and −60 mV. Datasets indicated by asterisk are quoted from a previous study22. Same mutants are indicated by the same color codes. The fitted curves for the D295N and D295A action spectra were adjusted to the photocurrents activated by light of 440 nm or higher wavelength. Absorption spectrum of the D295A mutant could not be measured, due to its instability in the detergent solubilized form, and thus is not included in the panel (h)

