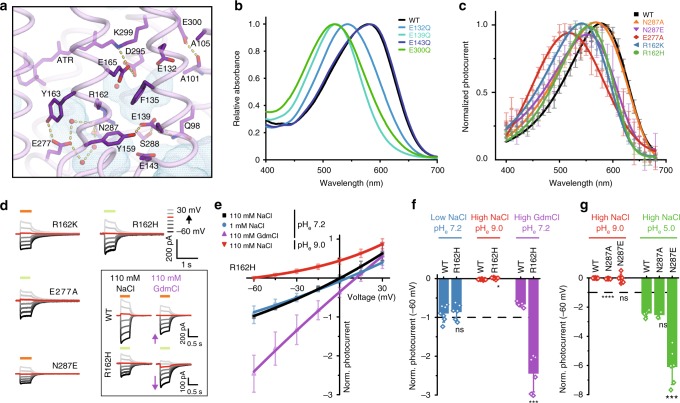
Fig. 4.
Outer gate and the extracellular ion pore. a Residues around the outer gate are shown as sticks, with the interactions indicated by yellow lines. Water accessible cavities are indicated by blue meshes. b Absorption spectra of the carboxylate mutants within the extracellular ion pore and the outer gate. c Mutations in the extracellular ion pore caused blue-shifting of the action spectrum. Normalized peak photocurrents after 10 ms excitation at different wavelengths of equal photon count (Mean ± SD; n = 5–7; symmetric 110 mM NaCl, pHe,i 7.2 and −60 mV) are shown. d Representative photocurrent traces of the Arg162 and Asn287 mutants at different voltages illuminated either with 550 nm light (green line) or with 580 nm light (orange line) depending on peak absorption. The inset shows representative photocurrent traces of wild type (upper) and R162H (bottom) upon replacement of Na+ with guanidinium. The purple arrows indicate the photocurrent increase or decrease upon cation exchange in the R162H mutant and Chrimson WT, respectively. e Current-voltage dependence of normalized R162H photocurrents in extracellular solutions of different cation or proton composition (mean ± SD; n = 6–9; intracellular 110 mM NaCl, pHi 7.2). R162H is still selective for protons, as the current-voltage dependence drastically shifts under the alkaline conditions (two-sample t-test with p = 0.025), while it is not affected by decreasing the Na+ ion concentration (p = 0.75). In contrast, the current-voltage dependence is drastically shifted when Na+ is replaced by guanidinium (p = 0.0002), indicating that R162H is permeable to guanidinium. f Normalized photocurrents at the ionic conditions of (e) and −60 mV compared to WT (Mean ± SD, n = 5–10; intracellular 110 mM NaCl, pHi 7.2, junction potential corrected). g Normalized photocurrent amplitudes of WT and N287 mutants at different extracellular pH (Mean ± SD; n = 2–10; intracellular 110 mM NaCl, pHi 7.2; −60 mV). Photocurrents of both mutants and WT were equally reduced at low proton concentration indicating comparable high proton selectivity (two-sample t-test compared to WT with p < 0.0001 for N287A and p = 0.9 for N287E). At extracellular pH 5.0 photocurrent increase of the N287E mutant was significantly higher than for WT or the N287A mutant (p = 0.5 for N287A and p = 0.0005 for N287E)

