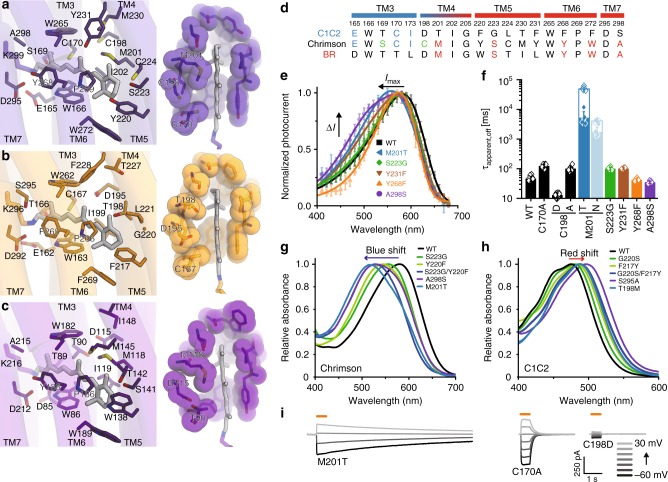
Fig. 5.
Retinal binding pocket. a–c Structural comparisons of the retinal binding pockets of Chrimson (a), C1C2 (b), and BR (c). As the retinal pockets of C1C2 and CrChR2 are quite similar, C1C2 is shown as the representative structure of the CrChRs. Residues constituting retinal binding pocket are shown in sticks (left panels). CPK model representations shows different association in the retinal binding pocket (right panels). d Sequence comparison of Chrimson with C1C2 and BR. The residue numbering of Chrimson is indicated above the sequence. Chrimson resembles BR in TM5–7, surrounding the polyene chain and β-ionone ring, while it resembles C1C2 (or CrChRs) in TM3, located near the ion-conducting pore. Residues common to BR and C1C2 are depicted in cyan and red, respectively. e Mutations that affect action spectrum. Normalized peak photocurrents after 10 ms excitation at different wavelengths of equal photon count (Mean ± SD; n = 5–8; symmetric 110 mM NaCl, pHe,i 7.2 and −60 mV) are shown. f Apparent photocurrent off-kinetics of retinal binding pocket mutants (τapparent off; Mean ± SD; n = 5–11; symmetric 110 mM NaCl, pHe,i 7.2 and −60 mV). Empty columns for M201T and M201N represent conductance measurements by short 20 ms voltage pulses to −60 mV at 0.2 and 0.5 Hz, respectively, and at a holding potential of 0 mV in order to reduce kinetic artefacts imposed by intracellular acidification due to continuous proton influx as previously reported22 (Mean ± SD; n = 5–6). g, h Absorption spectra of wild type and mutant Chrimson (g) and C1C2 (h). Mutations at the same positions are indicated by the same color codes. Peak shifts caused by mutation is indicated by blue or red arrow. i Representative photocurrent traces of the M201T, C170A, and C198D mutants, measured at different voltages in symmetric 110 mM NaCl, pHe,i 7.2 and illuminated with 580 nm light (orange line)

