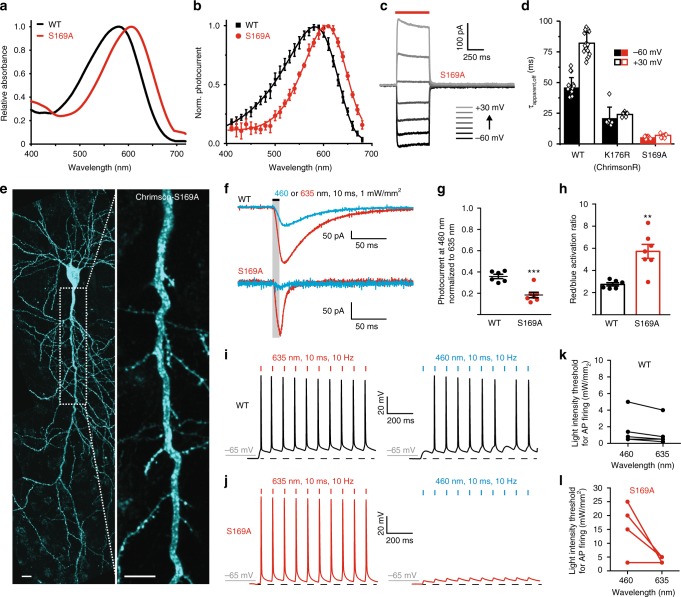
Fig. 6.
Chrimson-S169A in rat CA1 pyramidal cells. a, b Red-shifted absorption spectrum (a) and action spectrum (b) of Chrimson S169A (ChrimsonSA) (Mean ± SD; n = 7; 10 ms illumination of equal photon counts, symmetric 110 mM NaCl, pHe,i 7.2 and −60 mV). c, d Photocurrents of ChrimsonSA in HEK cells. Representative photocurrent traces (c) and channel closing kinetics (d) at the same ionic conditions as in (b) are shown. e CA1 pyramidal neuron heterogeneously expressing ChrimsonSA-mCerulean, 5 days after electroporation (stitched maximum intensity projections of two-photon images). The inset shows a magnified view of the apical dendrite. The scale bars indicate 10 μm. f Representative photocurrent traces of Chrimson-WT (top) and ChrimsonSA (bottom) expressing CA1 pyramidal cells evoked with either 635 nm (red trace) or 460 nm (blue trace, 1 mW/ mm2) light. The ChrimsonSA traces were scaled to WT Chrimson g Relative photocurrent responses of WT Chrimson and ChrimsonSA to blue light (460 nm, 10 ms, 1 mW/ mm2). Values were normalized to the response to red light (635 nm, 10 ms, 1 mW/ mm2). Dots represent single cells. Lines show mean ± SEM (nWT = 6; nS169A = 7). h Quantification of the red/blue activation ratio. Bar plots show mean ± SEM. i, j Action potentials triggered by red light pulses at a frequency of 10 Hz in cells expressing WT Chrimson (i) and ChrimsonSA (j) at threshold light intensities of 0.5 and 5 mW/mm2, respectively. Using the same light intensities, the action potentials were triggered by blue light in WT, but not in the ChrimsonSA. Dashed lines represent the membrane resting potential. k, l The light intensities at 460 nm and 635 nm required to reach the action potential threshold in neurons expressing WT Chrimson (k) or ChrimsonSA (l)

