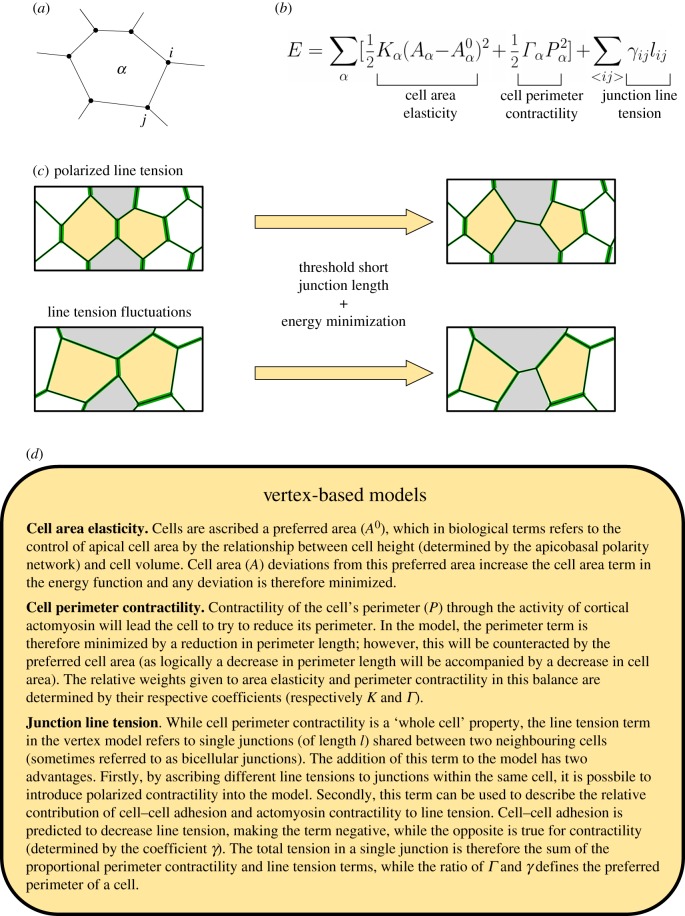
Figure 4.
Vertex modelling of intercalation. (a) Schematic representation of vertex model cells (α) and junctions (ij). (b) Vertex model behaviours are determined by an energy function comprising three key terms: cell area elasticity, cell perimeter contractility and junction line tension. (c) Implementation of intercalation in vertex models. Intercalation can arise either by polarized line tension (top) or by fluctuations in line tension around a global mean (bottom). Line tension magnitudes are indicated by the thickness of green junctions. Old neighbours are in yellow, new neighbours in grey. Intercalations occur when junctions reach a threshold short length and the rearrangement induced by an intercalation reduces the total energy. (d) Summary of vertex model terms and parameters.

