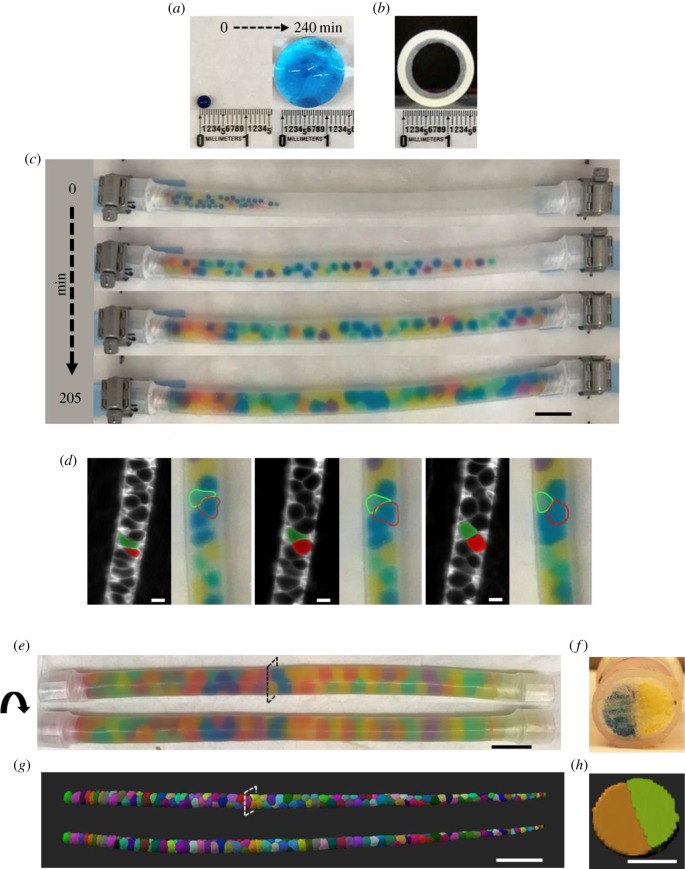
Figure 1.
A physical model recapitulates the organization and key behaviours of the zebrafish notochord. (a) A single JB before (left panel) and after (right panel) being placed in a water bath to grow unrestricted. (b) Cross-section image of an empty circular silicone tube (inner diameter, 12.7 mm). (c) Time-lapse images of JBs swelling in a capped silicone tube. Scale bar, 2.5 cm. (d) Still images from time-lapse movies of vacuolated cells in the notochord of a zebrafish embryo starting at the 20-somite stage and JBs as they settle in their final arrangement. Two cells wedging into a staircase arrangement are pseudo-coloured in green and red. A similar behaviour is highlighted for JBs traced with dotted lines. Scale bar, 20 µm. (e) Rotating views of a silicone tube filled with 80 JBs. (f) Cross section of the tube shown in (e) taken at the indicated level. Scale bar, 2.5 cm. (g) Dorsal (top) and lateral (bottom) views of a three-dimensional rendering of a 48 h post-fertilization (hpf) wild-type (WT) zebrafish expressing plasma-membrane-targeted green fluorescent protein (GFP) in vacuolated cells of the notochord. Note similarities between the arrangement of vacuolated cells, mainly in a ‘staircase’ pattern, and the JB tube shown in (e). (h) Orthogonal view of the notochord shown in (g). Scale bars, (g) 200 µm, (h) 50 µm.

