Figure 6.
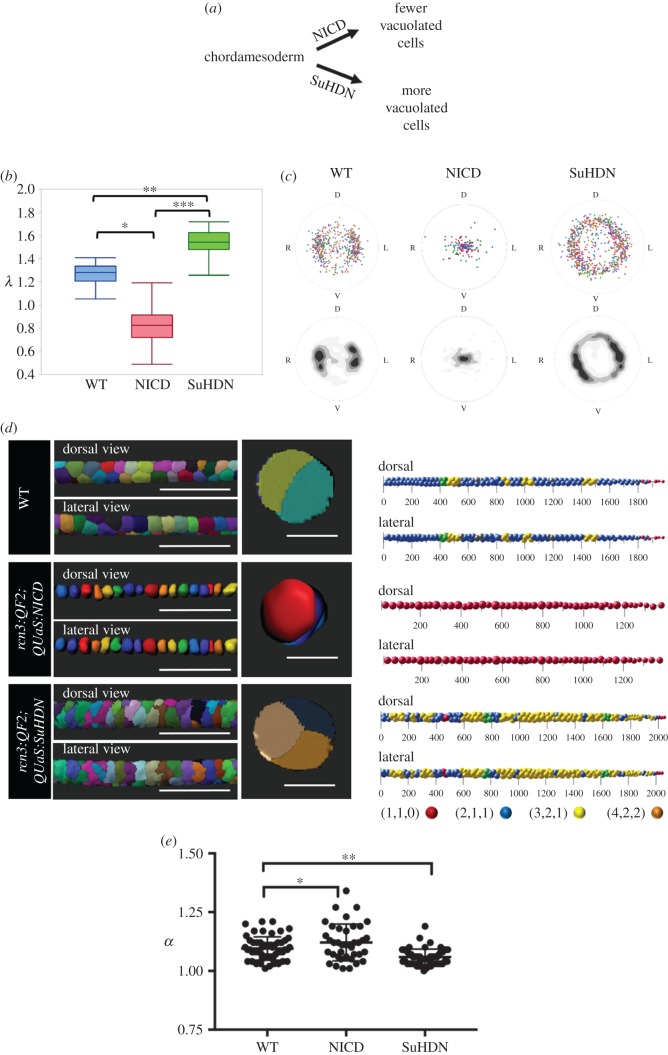
Vacuolated cell density determines their arrangement in the zebrafish notochord. (a) Schematic showing the effect of expressing NICD or SuH-DN in the early notochord (chordamesoderm). (b) Average λ values obtained from three-dimensional reconstructions of notochords in 48hpf WT, NICD and SuHDN embryos (n = 4, p < 0.0001, one-way ANOVA). (c) Centroid plots and heat maps of vacuolated cells from 48hpf WT (left), NICD (middle) and SuHDN (right) (n = 4). Orientation labels D (dorsal), V (ventral), L (left) and R (right). (d) Left panel, three-dimensional renderings of vacuolated cells showing dorsal, lateral and orthogonal (right panels) views of an approximate 500 µm segment of notochord from 48hpf WT (top), NICD (middle) and SuHDN (bottom) zebrafish. Right panel, Sphere plots of notochord vacuolated cells of the 48hpf WT (top), NICD (middle) and SuHDN (bottom) zebrafish embryos shown in (b). Patterns of vacuolated cell arrangement are colour coded as follows: blue (2,1,1), yellow (3,2,1), red (1,1,0), orange (4,2,2), green (transition between 2,1,1 and 3,2,1) and grey (uncertain). (e) Aspect ratio (α) of 500 µm regions, same as in (d), of the notochord rod in 48hpf WT (n = 5), NICD (n = 4) and SuHDN (n = 5) embryos (*p = 0.043, **p = 0.001, Dunnett's multiple comparisons test). Scale bars are 200 µm for three-dimensional rendering lateral and dorsal views and 50 µm for cross-sectional views.

