Fig. 4.
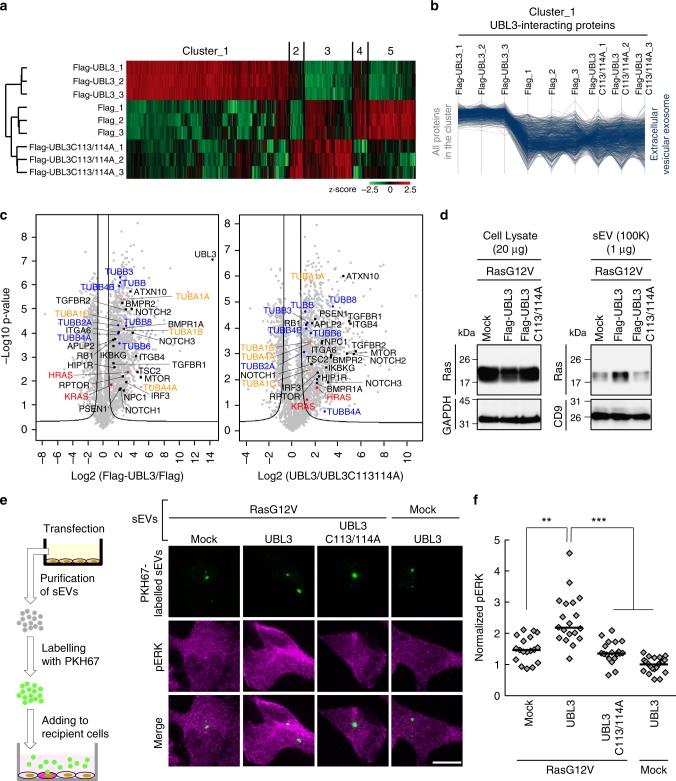
UBL3 modification influences the sorting of proteins to the sEV. a, b Heat map of z-scored LFQ intensities of the significantly regulated proteins (ANOVA, FDR = 0.05 & S0 = 1) in all three conditions (3xFlag-UBL3, 3xFlag-UBL3C113/114A or 3xFlag empty vector) revealed the UBL3 interacting proteins (Cluster 1). The colour key denotes normalised protein abundances (z-score). Profiles of all proteins (1447) found in Cluster 1 are shown and 454 of those (31%) with ‘extracellular vesicular exosome’ annotations are highlighted in dark blue. c Volcano plots showing the p-values vs. the log2 protein abundance differences in Flag-UBL3 compared with either Flag-UBL3C113/114A or Flag empty vector. The significance cut-off is based on an FDR = 0.05 and S0 = 1. Disease-related molecules, black colour. HRAS and KRAS, red colour. TUBA1A, 1B, 1C, and 4A, orange colour. TUBB, B2A, B3, B4A, B4B, B6, and B8, blue colour. d sEV pellets were blotted with anti-Ras antibodies. e Images of phosphorylated ERK (pERK) in PKH67-labelled sEV-incorporated MDA-MB-231 cells. Purified sEVs from the conditioned medium of MDA-MB-231 cells transfected with RasG12V and either mock, 3xFlag-UBL3, or 3xFlag-UBL3C113/114A or with mock and 3xFlag-UBL3 were labelled with PKH67 dye (green) and added to MDA-MB-231 cells. Scale bars, 10 μm. f Each plot shows pERK fluorescence in PKH67-labelled sEV-incorporated cells normalised to the average pERK values in the two neighbouring PKH67-labelled sEV-unincorporated cells from each image in e. RasG12V-mock, n = 18; RasG12V-UBL3, n = 19; RasG12V-UBL3C113/114A, n = 19; Mock-UBL3, n = 21. **, p < 0.01; ***, p < 0.001 by Kruskal–Wallis/Dunn's multiple-comparisons test

