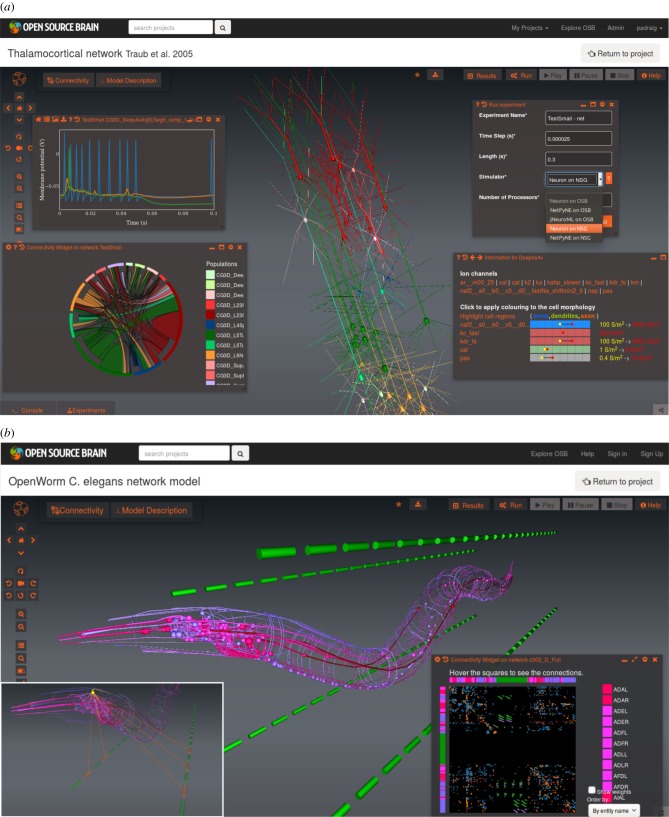
Figure 3.
(a) Screenshot of a reduced thalamocortical network model [26] on OSB showing analysis and simulation widgets provided by Geppetto and the Geppetto frontend OSB extension. Centre of screen shows 3D rendering of the 12 populations of pyramidal cells and interneurons. Widgets shown are (clockwise from top-left): plot showing recorded membrane potentials from three cells of a previously run experiment; run dialogue for selecting simulators and running experiments; widget showing ion channels and their densities for a single-cell model; chord diagram showing connectivity between populations. (b) Visualization of the neuronal network model of C. elegans being developed by the OpenWorm project. Centre of screen shows 302 neurons (red: interneurons; pink: sensory; purple: motor neurons) and four quadrants of body wall muscles (green) located away from the body for clarity. Connectivity widget on lower right shows chemical synapses between individual neurons/muscles. Inset on lower left illustrates interactive exploration of network; selecting a single motor neuron (RMED in head) highlights the neurons connected to it, along with five muscles in two of the ventral quadrants.

