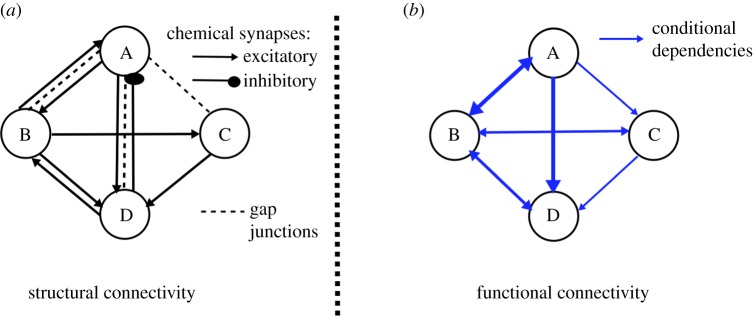
Figure 1.
Representation of a neuronal network as a graphical model. (a) Example of structural/anatomical connectivity map in which nodes denote neurons and edges map connections, e.g. chemical synapses and electrical gap junctions. Interactions between neurons produce a nonlinear network that dynamically transports stimuli to neuronal behaviours. (b) Example of PGM constructed from the neuronal network governed by the structural connectivity map and nonlinear dynamics. In the PGM, nodes are random variables corresponding to neuronal states and edges are conditional probabilities. PGM structure captures functionality of the network and hence is typically different from the anatomical connectivity map. (Online version in colour.)

